Proposal: Coinbase INTX as an eligible hedging venue

This proposal requests that Ethena integrate with Coinbase International Exchange (INTX) as an eligible venue for a portion of its hedging flow, subject to technical and risk due diligence by the Ethena Risk Committee. If approved, the proposed integration would be implemented with Risk Committee guidance as Ethena hedging flow scales alongside the growth of Coinbase INTX.

This proposal for integration is posted as Coinbase INTX announces its integration with Copper Clearlopp, the Off-Exchange Settlement Solution that Ethena currently utilises to access centralized exchange liquidity on exchanges such as Bybit, OKX and Deribit.

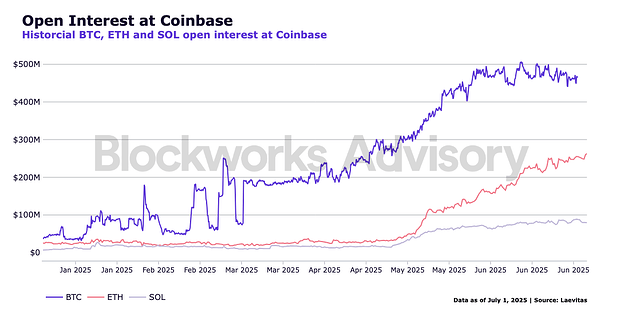
Coinbase INTX, which recently exceeded >$1bn of open interest, provides a meaningful surface of liquidity to diversify the hedging of the backing assets of USDe. INTX, via Copper ClearLoop, will settle mark to market with Copper every hour, 365 days a year.

This reduces potential counterparty risk even further, even via OES, as every hour, all unsettled balances are transferred between INTX & Copper, including unrealized PNL.

We invite the Risk Committee to conduct their technical due diligence on Coinbase INTX as an eligible hedging venue for the backing assets of USDe.

3 Likes

Analysis: Integrating Coinbase INTX as a Hedging Venue

This analysis is aimed at evaluating Coinbase International Exchange (INTX)’s suitability as a hedging venue. We’ve established that to evaluate new exchanges as viable venues for Ethena’s hedging strategies, several key criteria must be met:

  • Security: The exchange must have a robust history of security, including regular and up-to-date smart contract audits by top-tier, reputable audit firms.
  • Open Interest: The exchange should offer sufficiently large open interest to ensure Ethena’s positions remain a small portion of the total, avoiding any market-moving impact or liquidity concerns.
  • Funding Rates: Funding rates must align with those offered on centralized exchanges currently used by Ethena, particularly avoiding lower funding rates.
  • Legal and Regulatory Compliance: A thorough legal due diligence process should be conducted and verified by the Ethena Foundation to ensure the exchange operates within acceptable regulatory frameworks.

Security

From a security perspective, Coinbase presents relatively low risk as a trading venue for Ethena. Coinbase International Exchange (INTX) benefits from the broader Coinbase infrastructure, which has a long-standing reputation for reliability, regulatory alignment, and institutional-grade security. Its matching engine is built for deterministic execution and operates on a globally distributed, fault-tolerant Aeron cluster architecture with sub-millisecond latency and high throughput — up to 100,000 messages per second. This ensures not only speed but precision and consistency in trade execution, reducing the likelihood of slippage or order mismatches under stress.

Crucially, assets are not custodied on the exchange itself. Positions are collateralized and settled in USDC, with custody handled through third-party custodians, insulating Ethena from potential solvency or operational risks at the exchange layer. Coinbase also applies strict access control, real-time risk monitoring, and rigorous internal security practices — including regular penetration testing and security audits. Unlike other exchanges, it has no history of major breaches or loss of client funds. These infrastructure, execution, and custody protections together create a highly secure trading environment that aligns well with Ethena’s requirements for counterparty safety, operational resilience, and capital integrity.

Open Interest

We’ve generally established that Ethena’s positions should remain a small share of total open interest of each exchange, ideally no more than 10%, to avoid market impact and liquidity constraints. For that reason, it’s important to estimate the expected open interest on a new exchange, as this sets the upper bound on how much capital can be allocated to it.

Open interest for each asset across exchanges and Ethena's current share

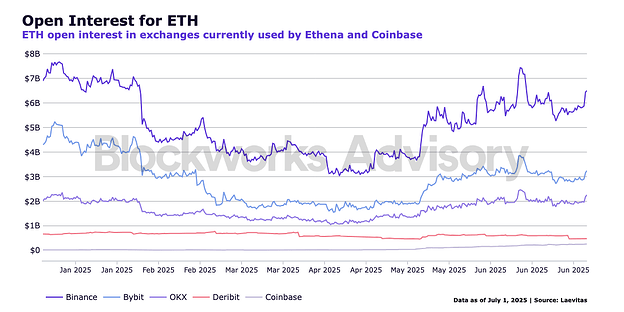
The following charts display the open interest trends over time across the exchanges where Ethena currently holds positions, as well as for Coinbase. Additionally, we highlight Ethena’s current share of the total open interest on each exchange.

Total BTC open interest as of Jul 7, 2025 (11:00h):

Exchange Ethena’s Position Total Open Interest Ethena’s Share (%)
Binance $920.25M $1.2B 7.66%
Bybit $436.8M $7.8B 5.59%
OKX $329.45M $4.1B 8.07%
Deribit $40.35M $2.0B 2.00%
Coinbase - $480M -

Total ETH open interest as of Jul 7, 2025 (11:00h):

Exchange Ethena’s Position Total Open Interest Ethena’s Share (%)
Binance $626.61M $6.21B 10.09%
Bybit $257.78M $2.99B 8.62%
OKX $109.56M $2.09B 5.24%
Deribit $1.56M $467M 0.33%
Coinbase - $255M -

Total SOL open interest as of Jul 7, 2025 (11:00h):

Exchange Ethena’s Position Total Open Interest Ethena’s Share (%)
Binance $31.19M $1.48B 2.11%
Bybit - $927M -
OKX - $645M -
Deribit - $14M -
Coinbase - $73M -

Based on current open interest levels on Coinbase, this translates into the following maximum capital allocations under our 10% OI threshold: approximately $48 million for BTC, representing around 2.7% of Ethena’s current BTC backing; $26 million for ETH, also about 2.7% of its ETH backing; and $7.3 million for SOL, which amounts to a significantly higher 23.4% of SOL backing.

Although Ethena can currently use Coinbase to hedge only around 3% of its total BTC and ETH positions, open interest on the exchange has been rising sharply, for example, BTC open interest has increased fivefold since the start of the year. This trend suggests that whitelisting Coinbase as a trading venue could become increasingly important in the near future, as growing liquidity expands the capacity for meaningful capital allocation.

Funding rates

Funding rates are typically calculated based on the difference between the contract price and the spot price of the underlying asset, incorporating both an interest component and a premium component.

For Coinbase, the calculation takes the difference between representative futures prices (futures mark) and spot prices (spot mark) every second over an hour. The average of these datapoints will be taken and scaled down to represent the premium between the futures price and spot price over the hour. To create a more stable and smooth funding rate, a smoothing factor is applied.

TWAP (Premium, 1 hour, 1 second) *É‘) + (Previous Funding Rate) * (1-É‘)

Where

Premium = (Mark price - Index Price) / Index Price / 24

É‘ = smooth / (n + 1);

smooth = 6;

n = number of previous periods used = 7 (funding interval)

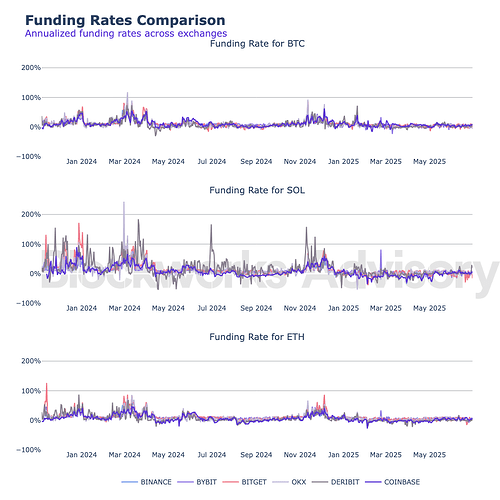
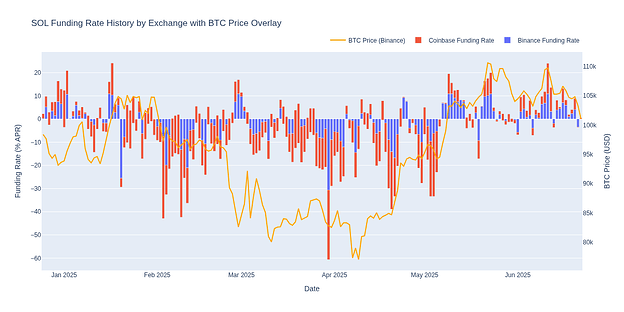
The chart above clearly illustrates significant volatility in funding rates, particularly for SOL, which aligns with our expectations. Annualized funding rates for BTC have not spiked higher than 65% at its peak in December 2024 and have been lower than 20% since March of this year.

When compared to other exchanges where Ethena currently holds positions, Coinbase’s funding rates appear notably more stable, exhibiting lower variability. This is explored in more detail for each asset later in the analysis, but is also consistent with Coinbase’s funding rate methodology, which incorporates smoothing techniques and considers the previous funding period. In contrast, exchanges like Binance calculate funding rates in isolation each cycle, without continuity or smoothing.

In-depth Analysis of BTC: summary statistics, autocorrelation patterns and extreme event analysis

BTC

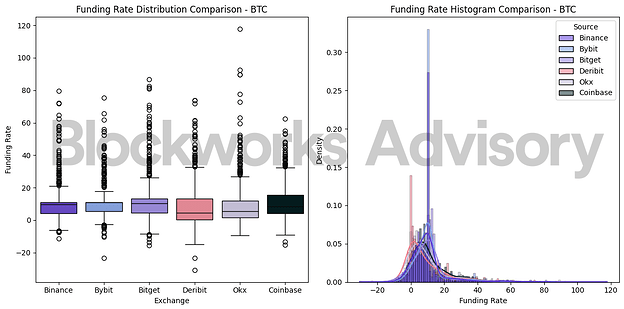
Taking a closer look at the distribution of funding rates across exchanges over the past year allows us to more precisely quantify these differences — examining how they manifest in summary statistics, autocorrelation patterns, and the duration of funding spikes. To capture a wide range of market conditions and better understand how funding rates have behaved across different environments, we analyze historical funding data spanning from November 2023 to June 2025.

Coinbase’s average annualized funding rate for BTC is 11.06, placing it in second place of the observed exchanges. It’s slightly above Binance (10.06) and Bybit (10.67), but below Bitget (11.41). This suggests that, on average, Coinbase’s BTC funding rates are relatively moderate to high. The median funding rate on Coinbase (8.36) is lower than that of Binance, Bybit, and Bitget. This indicates that while Coinbase’s mean is moderately high, its central tendency is actually lower than most peers. The difference between Coinbase’s mean and median suggests the presence of a few higher funding spikes that pull up the average, which is also supported by the skew and kurtosis values.

Coinbase shows a standard deviation of 11.07, which is in the same ballpark as Binance, and lower than OKX, Deribit and Bitget. This points to low relative variability in Coinbase’s funding rates - less volatile than Deribit, OKX and Bitget, just not as stable as Bybit.

Where Coinbase truly differs is in its distributional shape:

  • Kurtosis of 2.27 is the lowest among all exchanges, indicating that Coinbase’s funding distribution is closest to a normal distribution, with fewer extreme outliers or fat tails.
  • Skewness of 1.37 is also the lowest, suggesting Coinbase has the least pronounced positive skew. Its funding rates are less right-tailed, meaning fewer unusually high funding spikes compared to other exchanges. This is less beneficial for a basis trade, as profitability depends on high positive funding rates.

This aligns with Coinbase’s smoothed funding rate mechanism, which applies a form of exponential averaging over prior periods. Unlike exchanges like Binance and Bitget, which calculate funding rates on a per-interval basis with no memory, Coinbase’s formula incorporates previous funding rate values. This naturally dampens sudden swings, leading to smoother and less reactive distributions.

The autocorrelation chart displays how the funding rate correlates with its own past values at various time lags (in days). Values near 1 indicate a strong relationship, while values close to 0 suggest little to no correlation.

Among exchanges, Binance exhibits the highest persistence, with autocorrelation values staying high over more days. This implies that funding rates on Binance tend to change more gradually. Coinbase comes as a close second, implying consistent rates, which corroborates the previous findings.

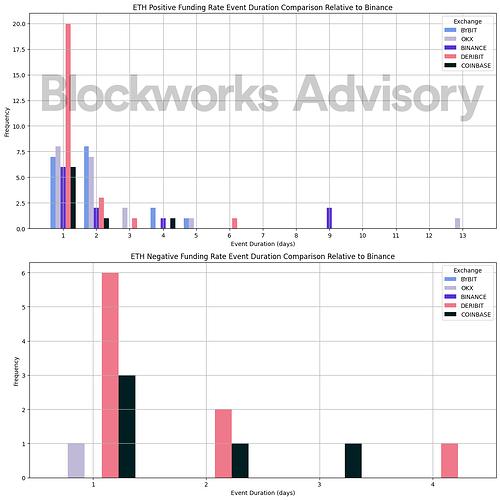
After having established that Coinbases’s funding rates are tendentially slightly lower and display reduced variability, it is also relevant to consider how long spikes in funding rates last, in particular negative ones.

The charts below identify events when an exchange’s funding rate is significantly higher or lower than Binance’s average funding rate. We use Binance’s mean and standard deviation as a benchmark for all exchanges and count an event as significant for any exchange where the funding rate exceeds a threshold around Binance’s mean (more than 2 standard deviations above or below Binance’s mean).

We can observe the event duration and frequency. Long durations indicate persistent deviations from Binance’s threshold (e.g., funding rate remaining high or low relative to Binance). Higher frequency in specific duration ranges shows how often an exchange’s funding rate behaves differently than Binance. For instance, we can see that Coinbase has some events that last one or two days and three events that lasted 5 or 6 days. However, these were all positive funding rate events where Coinbase’s funding rate was much higher than Binance’s average. Only on one occasion was there a negative event, lasting two days.

In-depth Analysis of ETH: summary statistics, autocorrelation patterns and extreme event analysis

ETH

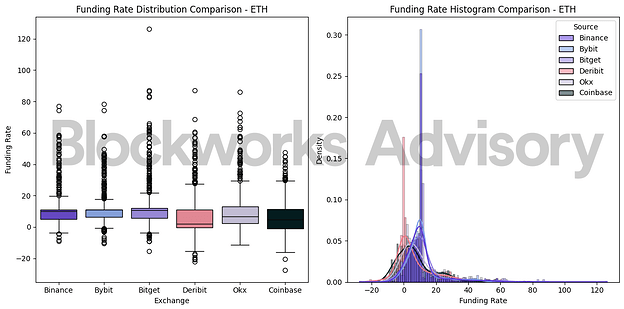
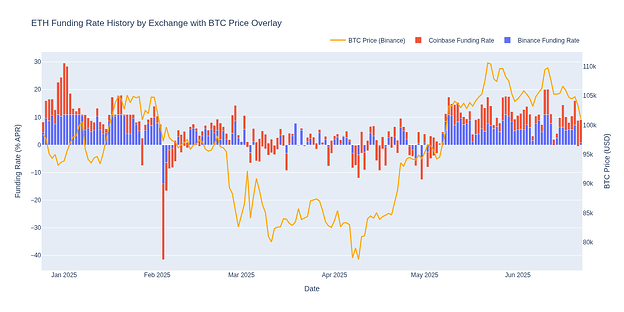
For ETH, the difference between Coinbase and other exchanges is more pronounced than it was for BTC. Coinbase has the lowest mean and second lowest median funding rates for ETH across all exchanges:

  • Mean: 6.53 vs. 10–12 on others
  • Median: 4.60, far below Bybit (10.95) and Bitget (10.57)

This suggests that ETH perps on Coinbase consistently fund at a lower rate, both on average and across the central distribution. The drop is much sharper than what we saw with BTC, where Coinbase sat in the mid-range.

Volatility (std) is comparable to Binance and Bybit, but lower than Bitget, Deribit, and OKX.

Where Coinbase stands out most is again in its distribution shape:

  • Kurtosis: 0.81, significantly below all other venues (next lowest is 4.3)
  • Skewness: 0.88, while others are all above 1.7

This means Coinbase’s ETH funding distribution is less heavy-tailed and more symmetrical than others, suggesting a remarkably stable and tightly centered funding environment, even more so than a normal distribution, with very few outliers and almost no fat tails or long positive drifts. BTC also showed lower kurtosis and skewness on Coinbase, but ETH is even more muted.

The autocorrelation chart further underscores the stability of ETH funding rates on Coinbase, with each lag showing stronger correlation to the previous one than on any other exchange — including Binance. This suggests smoother, more persistent funding dynamics over time.

Alongside Deribit, Coinbase recorded the highest number of negative funding rate events during the analyzed period. There were five such occurrences in total — three of them lasting just one day, while the remaining two persisted for two and three days, respectively.

In-depth Analysis of SOL: summary statistics, autocorrelation patterns and extreme event analysis

SOL

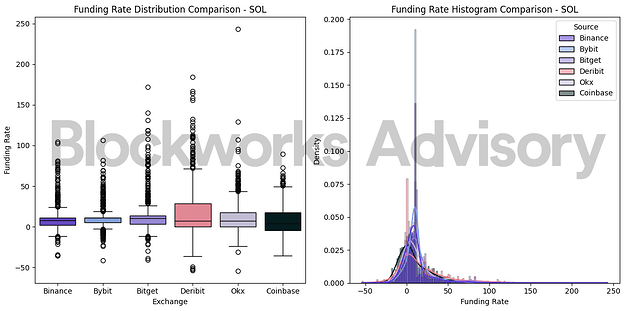
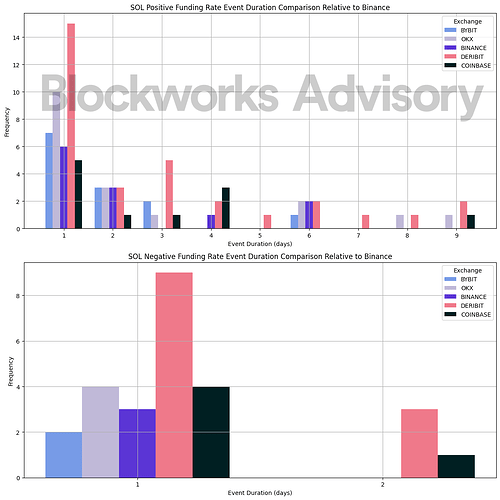
The results for SOL align with previous findings and do not provide relevant additional insights, so we include them for completeness but omit detailed analysis.

Conclusion

While Coinbase exhibits lower median funding rates across all assets—particularly for ETH—making it a less attractive venue from a pure basis trade profitability standpoint, it still plays an important strategic role in Ethena’s broader hedging framework. The stability and predictability of its funding rates, driven by its smoothing mechanism, significantly reduce the risk of unexpected negative carry. For ETH in particular, Coinbase shows the lowest skewness and kurtosis among peers, highlighting an unusually stable and symmetric funding environment.

Whitelisting Coinbase therefore adds value by diversifying counterparty risk and providing the trading team with greater flexibility to optimize funding yields dynamically. In volatile markets, this flexibility can be used to rotate capital toward higher-yielding venues while avoiding negative carry scenarios on Coinbase altogether. As liquidity continues to grow on the platform—evidenced by the sharp rise in open interest—its relevance as a hedging venue is likely to increase, making it prudent to establish infrastructure and whitelisting today in anticipation of expanded usage in the near future.

1 Like

This post analyses the potential of Coinbase INTX as a new hedging venue for Ethena. Credio (by Untangled) focuses on open interest and funding rates, based on publicly available information.

Open Interest and Market Depth

Open Interest

This table snapshots Coinbase INTX’s Open Interest (OI) vs. those of Binance, the largest perp exchange and the largest venue for Ethena vs. the global OI.

Coinbase INTX currently holds only around 4% of Binance’s OI and around 1.5% of worldwide OI in BTC and ETH.

Total Open Interest

Global Binance Coinbase
BTC $32.8B $11.35B $470.05M
ETH $15.5B $5.95B $244.63M
SOL $1.36B $84.40M
Source: coinglass at 2025/06/25

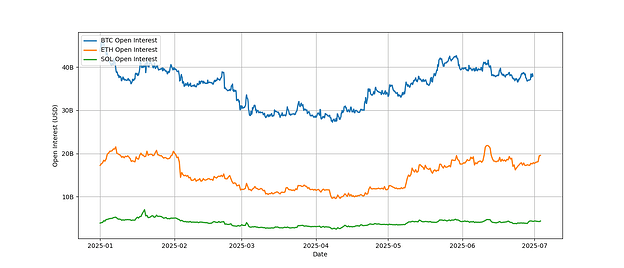
This line chart compares total aggregated open interest for BTC, ETH, and SOL across all exchanges over the first half of 2025.


Source: Exchanges’ public APIs

BTC maintained a dominant lead in open interest throughout the period, peaking above $45B. ETH consistently held the second position, ranging from $10B–$20B, while SOL lagged with OI typically under $5B. The proportional gap between BTC and others remained steady, reaffirming BTC’s role as the primary instrument in derivatives markets.

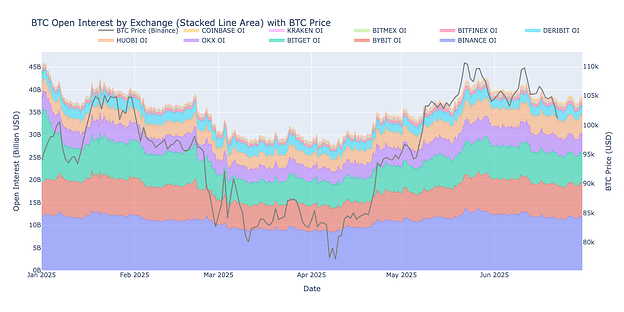
This chart shows the cumulative BTC’s OI across major futures exchanges from January 1 to July 1, 2025. Each colored area represents a different exchange, stacked to highlight the contribution of each. The orange line overlays the BTC spot price on the secondary y-axis.


Source: Exchanges’ public APIs

From early January to July 2025, total BTC open interest fluctuated between $25B–$45B. Binance, Bybit, and Bitget consistently held dominant shares. Notably, spikes in OI often preceded or coincided with significant BTC price movements, suggesting leveraged positioning ahead of volatility.

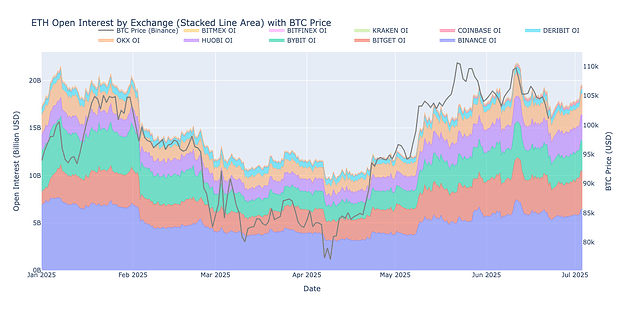
ETH futures OI by exchange is visualized as a stacked area chart, with BTC spot price as an overlaid reference. The time frame spans H1 2025. Unlike BTC market where Coinbase ranks the lowest among the top 10 centralised perp exchanges, it ranks ahead of Kraken, Bitfinex and Bitmex in the ETH market


Source: Exchanges’ public APIs

While ETH OI remained smaller than BTC, the patterns loosely mirrored BTC price trends. Notably, increases in ETH OI sometimes anticipated BTC price rallies, hinting at correlated speculative activity.

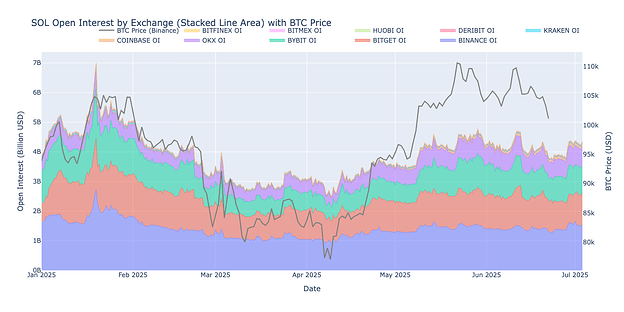
Solana (SOL) open interest by exchange, stacked by market share, with BTC price overlaid. Time range: Jan–Jul 2025.


Source: Exchanges’ public APIs

SOL open interest remained significantly lower in magnitude than BTC and ETH, mostly below $5B. Exchanges like Binance, Bitget and Bybit led SOL derivatives volume. Despite its lower notional value, SOL OI showed notable upticks in late Q2, broadly consistent with the overall market development.

Market depth

In terms of trading volume, Coinbase INTX has been seeing $4–5 billion in 24h volume recently, with the BTC-USDC perp alone trading about $3.0B in a day. However, liquidity is concentrated in the largest pairs (BTC, ETH; possibly SOL to a lesser extent). Order books are supported by independent liquidity providers vetted by Coinbase, which likely contributes to relatively tight spreads and reasonable depth in top markets BTC and ETH.

Currently Ethena represents around 3% of global BTC OI and around 9% of global ETH OI across its venues. It would be neither possible nor advisable to put a large size on Coinbase INTX initially, given BTC OI and ETH OI of around $464M and $248M respectively.

Coinbase INTX’s market depth for moderate allocations appears sufficient. The top contracts have high daily turnover (BTC’s OI ~$464M vs $3B+ daily volume, indicating more than 6x turnover per day, so Ethena can enter and exit positions incrementally without major price impact, especially using algorithmic execution. Additionally, Coinbase’s ultra-low latency matching engine and incentives for market makers suggest that liquidity will continue to grow, tightening spreads further. We also note that Coinbase’s spot market launch (BTC/USDC, ETH/USDC) may attract more arbitrageurs and liquidity to INTX’s perp markets, improving depth and convergence with global prices.

Ethena should aim to be a single-digit percentage of Coinbase’s OI per asset at most. For example, an initial $20–25M ETH short on INTX would be ~8–10% of INTX’s ETH OI, and a $30–46M BTC short would be ~6–10% of INTX’s BTC OI, which are in line with or slightly above the thresholds Ethena has aimed for on other venues. These levels should not materially destabilize Coinbase’s market (especially if split among multiple liquidity providers and entered gradually). By keeping Ethena’s share of Coinbase’s OI in this range, Ethena can minimize the risk of dominating the order book or skewing the funding rates.

In summary, Coinbase INTX offers reasonably deep markets for BTC and ETH, suitable for incremental hedging. The liquidity is not as deep as Binance/Bybit, so Ethena should size positions appropriately to avoid liquidity concentration risk. However, the presence of active high-volume trading on INTX (~$4.5B daily) and Coinbase’s efforts to attract market makers signifies that Ethena could execute tens of millions in hedges on INTX without significant slippage. Ethena should employ limit orders or TWAP strategies for entry/exit to minimize market impact.

Funding Rates

Since Ethena’s hedging strategy involves taking short positions in perpetual futures, funding rates (paid by long positions to shorts when the perp price is above the index, or vice versa) directly affect Ethena’s cost or revenue from hedging. Ethena seeks venues where funding is reliably in its favor (i.e. longs pay shorts at a decent rate), or at least not consistently punitive to shorts.

Coinbase INTX uses a standard funding rate model akin to other major exchanges. Funding payments occur on a 1-hour basis (many exchanges use 8-hour cycles). The rate is calculated based on the premium of the perp price over the spot index and an interest rate component. In essence, if perpetuals trade above spot, longs pay shorts, and if below spot, shorts pay longs – with the goal of converging the perp to the spot price (Refer to Calculation).

In the following section, we performed statistical analysis on Coinbase INTX, in comparison with the largest perp exchange, Binance.

Summary statistics for BTC

Binance Coinbase Comments
Mean APR (%) 4.690 6.346 Coinbase INTX offers a higher average funding yield: favorable for Ethena’s shorts.
Std Dev (%) 4.664 7.703 Funding on INTX is significantly more volatile: increases PnL variability and requires dynamic risk limits.
Skewness -0.488 1.943 Binance slightly favors balanced or negative funding.Coinbase INTX shows strong right skew: frequent spikes for shorts but also bigger swings.
Min (%) -13.394 -30.660 Extreme negative funding possible on INTX: Ethena must monitor tail risks and cap exposure.
Max (%) 10.950 108.624 Coinbase INTX can deliver large positive funding spikes: opportunities for high earnings but also high volatility.
25th Percentile (%) 1.430 2.628 Even low-end funding on INTX is higher: good for steady carry on shorts.
75th Percentile (%) 8.590 9.636 Higher upper-quartile funding on INTX: shows consistently elevated positive funding levels for shorts.

Source: Exchange public API from 2024/12/26 to 2025/06/22 (180 days).

Summary statistics for ETH

Binance Coinbase Comments
Mean APR (%) 4.936 0.345 Significantly lower average funding on Coinbase INTX: less attractive for short hedges.
Std Dev (%) 5.210 6.384 Slightly higher volatility on INTX: unpredictability in ETH funding PnL.
Skewness -1.028 -0.749 Both negative: funding on ETH tends to lean negative, i.e. shorts may often pay longs.
Min (%) -27.507 -82.344 Large negative funding spikes on Coinbase INTX: costly for shorts if market flips bearish.
Max (%) 10.950 30.660 Coinbase INTX has potential positive spikes for shorts, but not reliable due to low mean APR
25th Percentile (%) 1.368 -4.380 25% of the time, funding is negative on INTX, implying shorts are paying
75th Percentile(%) 9.530 4.380 Upper quartile funding still lower on INTX than on Binance: even in good conditions, INTX delivers less income for ETH shorts.

Source: Exchanges’ public APIs

Summary statistics for SOL

Binance Coinbase Comments
Mean APR (%) -0.198 -5.020 Both negative: shorting SOL incurs average funding costs. INTX is significantly worse, suggesting shorts pay heavily on average.
Std Dev (%) 9.697 9.881 High volatility on both venues: funding is highly unstable for SOL shorts.
Skewness -2.047 -0.631 Strong negative skew on Binance indicates frequent deep negative funding spikes. INTX skew is less extreme but still negative: shorts are often at a disadvantage.
Min (%) -77.909 -86.724 Both venues show extreme negative funding tails: cost risk for SOL shorts.
Max (%) 10.950 63.948 INTX shows potential large positive funding spikes, but is rare and unpredictable.
25th Percentile (%) -5.271 -11.388 Funding is highly negative on INTX, significantly worse than Binance.
75th Percentile(%) 7.198 1.752 Even when funding turns positive, INTX underperforms Binance

Source: Exchanges’ public APIs

Note: Binance uses 8 hours funding fee while Coinbase INTX settles every hour.

In summary, based on data for 180 days ending June 22 2025:

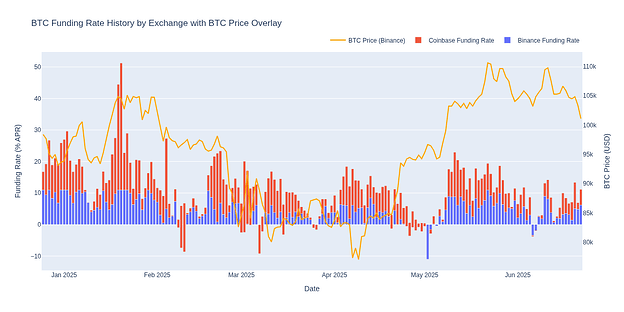
  • BTC: Coinbase INTX offers higher average funding rates, enhancing Ethena’s hedging carry, but comes with greater volatility and tail risk. This requires tight monitoring, dynamic exposure management, and stress testing to safely capture potential funding benefits

  • ETH: The low mean APR, frequent negative funding, and extreme downside spikes suggest ETH hedging on Coinbase INTX should be used only sparingly and opportunistically.

  • SOL: Average funding is deeply negative (–5.02% APR), with extreme negative spikes up to –86.724%. Even during positive periods, upside is limited.

BTC funding rate history chart with BTC price overlay


Source: Exchanges’ public APIs

ETH funding rate history chart with BTC price overlay


Source: Exchanges’ public APIs

SOL funding rate history chart with BTC price overlay


Source: Exchanges’ public APIs

Conclusion

Funding rate heatmap with BTC price overlay


Source: Exchanges’ public APIs

Based on the 180 day data, Coinbase INTX is a viable BTC hedging venue for Ethena, capable of improving yield through higher funding rates. However, the elevated volatility and extreme funding swings mean Ethena should deploy strong risk controls. For ETH and especially SOL, INTX is less suitable due to unfavorable funding conditions and tail risks. Integration should proceed, but with exposure limits capping at 10% and real-time monitoring.

1 Like

Risk Committee Assessment: Coinbase INTX as a Hedging Venue

Coinbase International Exchange (INTX) offers a distinct tradeoff profile relative to peer offshore venues. While it lacks the scale and liquidity depth of venues like OKX or Binance, it provides exceptional counterparty and custodial risk controls via its affiliation with Coinbase Inc. For Ethena, INTX is a suitable venue for limited directional or passive hedging but not optimal for capital intensive or highly tactical positioning. Our assessment favors incremental usage with defined sizing and risk boundaries.

Industry Positioning

Coinbase International Exchange (INTX) is a relatively new entrant in the offshore crypto derivatives space, having launched in 2023 under Bermuda regulation. As of July 2025, the venue lists over 150 perpetual contracts and averages approximately $4.4 billion in daily volume, with $1.13 billion in total open interest. Despite these figures, INTX remains an emerging player in terms of scale, trailing well behind entrenched competitors like Binance, Bybit, and Bitget, who support substantially higher open interest and deeper liquidity across major trading pairs.

In 2024, Coinbase announced the acquisition of Deribit, a leading offshore crypto options exchange. However, public details on the strategic integration between Deribit and INTX remain sparse. It is unclear whether these platforms will be operationally merged, remain independent, or eventually cross leverage infrastructure or market access. For now, INTX will be evaluated on a standalone basis, without assuming execution synergies or liquidity enhancements from the Deribit acquisition.

Management & Governance

INTX is a wholly owned subsidiary of Coinbase Inc. (NASDAQ: COIN), a publicly listed U.S. company. This structure provides governance alignment and transparency that is rarely present in offshore derivatives venues. Financial reporting, audits, and compliance practices follow SEC standards. Daily operations at INTX appear conservative and oriented toward institutional best practices.

While Coinbase does not ring fence liabilities from INTX, the reputational and legal entanglement between parent and subsidiary provides meaningful implicit support.

Financial Overview

Given the use of ClearLoop we omit a detailed analysis of Coinbase’s financial position. However, we note Coinbase Inc. maintains strong liquidity and capital reserves and has published GAAP compliant financials for 2024 with positive net income and substantial cash reserves (> $5B). These factors reduce the likelihood of cascading risk into INTX operation and eliminate any doubt regarding the venue’s sustainability, which would otherwise impact business continuity.

Risks & Mitigants

  1. Structural Order Book Thinness and Execution Sizing Limits: INTX’s derivatives markets remain materially thinner than other venues across both open interest and resting liquidity. As of July 17, BTC open interest on INTX stood at ~$498M, ETH at ~$256M, and SOL at ~$83M. These figures compare unfavorably to competitors with multi-billion dollar open interest per asset. The venue supports moderately sized participation, but practical execution thresholds are limited: directional or delta neutral trades above ~$25–50M in BTC/ETH, and materially lower in SOL. Order book depth beyond the top of book may be inconsistent, making large block trades operationally inefficient or costlier without external slicing or execution logic.
  • Mitigants: While INTX does not support high capacity rebalancing, it is suitable for slower moving hedge deployment at moderate sizing. For Ethena’s strategic use case focused on durability this capacity may suffice, especially for base hedges in BTC or ETH.
  1. Inconsistent Liquidity and MM Participation: INTX’s liquidity is materially shaped by market maker activity, which appears episodic across assets and time windows. Liquidity during non peak hours at times is thin, and depth recovery after volatility lags behind larger venues. SOL, in particular, exhibits sharp fluctuations in book resiliency and spread compression, reflecting a smaller and less consistent participant base. Blockworks Research notes that INTX’s MM coverage is currently “not robust compared to more mature derivatives venues,” a feature that may exacerbate price impact or delay fills during stress conditions.
  • Mitigants: Reduce impact by aligning execution with periods of stronger activity and avoiding discretionary size deployment in thin hours. Monitoring time of day liquidity and MM quoting depth should be a standard part of risk management when using INTX for rebalancing or tactical entries.
  1. Spread Behavior and TOB Characteristics: Despite thinner overall depth, INTX does offer competitive TOB pricing under normal conditions. Spread analysis from Untangled Research (July 2024) shows that for BTC and ETH perps, INTX maintains tight spreads (~0.01–0.02%), occasionally on par with Binance and OKX for small lot sizes. However, these spreads deteriorate rapidly with even modest sizing. Beyond ~$250K notional, slippage becomes measurable, and the absence of depth replenishment from MMs increases execution drag. This spread sensitivity limits the scalability of passive execution and places additional emphasis on careful order structuring.
  • Mitigants: For smaller hedge increments, INTX can be cost effective. But above certain thresholds, expect stepwise increases in cost per unit filled. Slippage modeling should incorporate more than TOB metrics and expected book shape under stress.
  1. Latency and Book Replenishment Limitations: Compared to some venues that benefit from high frequency MM competition and reactive quoting, INTX’s liquidity replenishment is slower. Order book recovery post execution tends to lag behind top venues, especially under directional flows or regime shifts. The platform does not currently support colocation or low latency access mechanisms, limiting its appeal for high frequency strategies. Combined with siloed order books (segmented from Prime/Advanced), this structure reduces execution agility and increases exposure to short term pricing anomalies.
  • Mitigants: For Ethena’s primarily strategic hedging posture, latency is not critical. Execution on INTX would experience more drift between parent and child orders and may require modeling for larger VWAP deviation during execution windows. Pacing logic and passive order grids may help mitigate latency driven degradation.
  1. Persistent Underperformance of Funding Rates: INTX’s funding regime has exhibited consistent underperformance relative to major offshore venues, with annualized ETH funding averaging just ~5 bps over the past quarter. This compares unfavorably with the ~80–140 bps commonly observed on Binance, OKX, and Bybit under comparable market conditions. The underperformance is not merely cyclical but appears to be structural—driven by INTX’s strict reliance on USDC collateral, conservative leverage limits, and a less speculative participant base. These design choices dampen open interest volatility and limit directional imbalances, reducing the natural sources of funding skew. Consequently, INTX often fails to reflect prevailing market sentiment or volatility premiums, compressing funding yields even in environments where other venues generate sustained double digit annualized returns.
  • Mitigants: From a risk standpoint, INTX’s flat funding curve reduces carry volatility and mitigates the risk of directional funding reversals—traits that are favorable for long dated delta hedges. However, it is poorly suited for strategies seeking to monetize short perp exposure or engage in dynamic funding arbitrage. Ethena should avoid allocating material capital to INTX for carry focused strategies and instead treat the venue as a stable, low volatility hedge rail. Funding metrics should inform dynamic venue selection, especially during regime shifts or periods of persistent skew.
  1. Slow Funding Responsiveness to Market Skew and Volatility: Even when broader markets exhibit pronounced long or short skew, INTX tends to lag materially in adjusting its funding rates. This slow reflexivity has been observed during directional rallies in ETH and BTC, where peers posted 10–15 bps daily while INTX remained neutral or even slightly negative. The lack of elasticity in funding stems from structural limitations of fewer high beta assets attracting speculative flows and the composition of counterparties, which skews more institutional and less momentum driven. As a result, INTX may lag in dynamically pricing risk or sentiment into funding, creating misalignment between directional bias and compensation.
  • Mitigants: For delta neutral hedges where the goal is to preserve price integrity rather than extract premium, this characteristic may be acceptable or even desirable. However, the inability to capture favorable funding conditions during volatility spikes introduces opportunity cost and should be explicitly modeled in expected carry assumptions. Ethena may treat INTX as a hedging venue with capped upside, and use adaptive funding monitoring to shift sizing elsewhere during rich skew periods.
  1. Limited Asset Mix Reducing Basis Dispersion: Although INTX now lists a broadening set of perpetuals beyond majors, the bulk of open interest (~75%) remains concentrated in BTC, ETH, and SOL. The absence of sustained liquidity in long tail or high volatility names constrains speculative capital rotation and narrows the distribution of basis opportunities. These assets typically fuel directional long/short imbalances that give rise to strong funding premiums. Without them, INTX’s perp market remains comparatively stable but shallow, missing the reflexivity that powers high carry in more retail driven venues.
  • Mitigants: INTX’s more limited asset set reinforces its positioning as a structurally conservative platform. While this reduces noise and directional whipsaws, it caps the utility of the venue in funding extractive portfolios. Ethena should maintain exposure within the well supported majors and treat any expansion in long tail listings as additive optionality, not core functionality. As additional markets deepen, dynamic monitoring of volume and funding responsiveness should guide future venue weightings.
  1. Differentiated Funding Calculation Methodology: INTX employs a unique funding rate calculation that diverges meaningfully from other venues. Instead of basing rates on direct mark to index premiums and borrowing costs, INTX uses a more static funding reference with stricter update intervals and narrower deviation bands. This leads to muted funding even when open interest tilts are observable or spreads widen meaningfully. As noted by other committee members, this methodology is less reflexive, reducing potential funding windfalls while enhancing rate predictability.
  • Mitigants: This design offers a predictable and transparent funding environment with minimal risk of sudden spikes. It also limits the impact of funding manipulation by short term flow, which can distort positions on more dynamic venues. However, Ethena should not rely on INTX to reflect real time sentiment or reward directional crowding. We recommend incorporating this funding mechanism explicitly in strategy modeling and viewing INTX primarily as a predictable cost center rather than a source of basis yield.
  1. Lack of Cross Collateralization with Spot: While INTX supports multi asset collateralization within derivatives, it does not currently offer cross collateral between spot and perpetual markets. This reduces flexibility for traders seeking to operate net neutral across venues or dynamically rebalance spot and perp exposure.
  • Mitigants: This is largely mitigated by ClearLoop integration and the ability to warehouse spot off exchange. Traders can post collateral at Coinbase Prime while transacting perps on INTX, reducing some friction. Additionally, portfolio margining within derivatives partially offsets this limitation for users with correlated positions. Still, integrated margin efficiency remains inferior to more complex venues.
  1. Segmented Order Book and Execution Friction: INTX appears to maintain a siloed order book that is not integrated with Coinbase Prime or Advanced. This separation limits routing efficiency and may create friction when sourcing liquidity, particularly during rebalancing or tactical adjustments. Unlike some venues with internal matching or smart routing between interfaces, INTX execution may remain venue bound.
  • Mitigants: This segmentation is a deliberate design tradeoff prioritizing regulatory clarity and client protection. While it limits smart routing benefits, it reduces systemic risk from internal liquidity opacity. Execution risks can be managed with pacing strategies and smart order logic by the trader. For strategies reliant on highly reactive routing, this remains a constraint.
  1. Limited Scale of SOL Market: The SOL market on INTX remains underdeveloped relative to ETH and BTC. With just ~$83M in OI and lower daily volumes, liquidity is more volatile, spreads are wider, and large trades may incur impact. Market maker activity appears inconsistent, and participant depth is limited.
  • Mitigants: This remains a known limitation of the venue. For SOL exposure, size should remain conservative until liquidity improves materially. However, the existence of a dedicated SOL market with low signaling risk still offers value for smaller hedges or testing tactical trades. Position limits should be actively managed based on time of day and spread monitoring.
  1. Lack of Block Trading / Dark Execution Tools: INTX currently does not advertise support block RFQs, internal crossing engines, or dark pools, which increases signaling risk and slippage. This constrains institutional participation in high velocity hedging or large rebalances.
  • Mitigants: INTX is reportedly exploring improvements in block execution, but no timelines are public. In the interim, the venue is best used for transparent execution where discretion is not paramount.
  1. Governance and Regulatory Risk: As a wholly owned subsidiary of Coinbase Inc., INTX inherits both strengths and vulnerabilities from its parent. While Coinbase’s listing on U.S. equity markets imposes rigorous audit, reporting, and compliance obligations, it also exposes INTX to potential extraterritorial regulation or litigation spillover. Changes in U.S. policy, enforcement actions, or legal rulings involving Coinbase could alter INTX’s operational stance. Coinbase may choose to restrict access, update onboarding requirements, or deprecate products in response to shifting risk tolerances.
  • Mitigants: Regulatory alignment and compliance culture are clear strengths for INTX, distinguishing it from many offshore venues. However, this alignment comes at the cost of operational flexibility. For Ethena, this risk suggests a need to treat INTX as a constrained venue. We recommend monitoring legal and regulatory developments involving Coinbase Inc. as a proxy for potential platform shifts.
  1. Liquidation Timing and Margin Drift Risk: INTX settles margin and PnL via ClearLoop on an hourly basis rather than continuously, allowing unrealized losses to persist across snapshots without immediate liquidation. This creates a potential for margin drift, where positions remain open longer than expected during sharp market moves. While ClearLoop custody and scheduled reconciliation reduce the likelihood of rogue or forced liquidations, the delayed enforcement cadence introduces modeling complexity. Hedging strategies should account for this latency, particularly under fast basis reversals or high volatility, and apply conservative buffer thresholds or stress testing to manage liquidation risk effectively.
  • Mitigants: Hourly settlement via ClearLoop materially reduces the likelihood of abrupt or rogue liquidations. Custodial separation also ensures that collateral remains user controlled. However, the delay in liquidation enforcement introduces modeling complexity. We recommend incorporating INTX’s margining cadence into stress test frameworks, particularly under scenarios involving sharp basis reversals or high volatility. Real time monitoring of unrealized PnL and adjusted buffer thresholds can mitigate latent liquidation risk.
  1. Strategic or Competitive Displacement Risk: INTX remains an emerging venue in a highly competitive derivatives landscape. Without significant ongoing investment and market maker engagement, there’s a risk that INTX’s liquidity plateaus or declines. If incentives wane, trading volumes could migrate to faster growing platforms, leading to deteriorating execution conditions and further concentration risk.
  • Mitigants: Current growth appears stable, with respectable OI across core assets, but INTX is not yet systemically important. We recommend treating the platform as supplementary infrastructure rather than a strategic dependency. Maintaining execution and funding benchmarks against top tier venues will ensure that deteriorating conditions are caught early. Volume caps or dynamic rebalancing logic can further reduce reliance on INTX as market conditions evolve.

Recommendations

INTX is suitable for Ethena as a secondary hedging venue. Its value lies in counterparty robustness and operational transparency, not execution depth or funding optimization. Given its relatively low market share and structural conservatism, INTX should complement, not replace, more tactical venues.

Asset Level Guidance:

  • BTC / ETH: Appropriate for passive or baseline hedge deployment, especially where sizing is moderate (<$25–50M) and price stability is prioritized over funding income.
  • SOL: Use with caution. Thin liquidity and inconsistent MM presence introduce slippage risk. SOL hedges should remain small, time sensitive, and continuously monitored.

Portfolio and Execution Strategy:

  • Diversification: INTX should form part of a broader venue rotation strategy that balances execution quality, funding yield, and counterparty risk. Its use can reduce exposure concentration on dominant venues like Binance and Bybit.
  • Funding Arbitrage / Carry: Not recommended. INTX consistently underperforms in funding rate dynamics and is poorly suited for funding led strategies.
  • Operational Role: INTX may serve as a reliable hedge rail during volatile periods when funding dislocations on other venues distort execution or risk.

On balance, INTX’s role is additive. It will effectively diversify venue risk, add counterparty strength, and offload size gradually when urgency is low.

1 Like