Hyperliquid Integration Analysis
The below analysis is also available in document format here
To evaluate new exchanges as viable venues for Ethena’s hedging strategies, several key criteria must be met:
- Security: The exchange must have a robust history of security, including regular and up-to-date smart contract audits by top-tier, reputable audit firms.
- Open Interest: The exchange should offer sufficiently large open interest to ensure Ethena’s positions remain a small portion of the total, avoiding any market-moving impact or liquidity concerns.
- Funding Rates: Funding rates must align with those offered on centralized exchanges currently used by Ethena, particularly avoiding lower funding rates.
- Legal and Regulatory Compliance: A thorough legal due diligence process should be conducted and verified by the Ethena Foundation to ensure the exchange operates within acceptable regulatory frameworks.
This analysis is aimed at evaluating Hyperliquid’s suitability as a hedging venue, particularly by examining whether the proposed initial allocation limits are appropriate based on these criteria.
Security
Relevant questions have already been sent as a response to the initial proposal. Hyperliquid has maintained a clean security record to date, with no reported incidents. However, it has undergone only two audits, both conducted by the same firm, Zelic, with the latest audit completed in November 2023. Given that significant updates have been made to the protocol and the L1 since that audit, this presents a potential risk. To mitigate this, we recommend a fresh, comprehensive audit is completed by at least one different reputable firm to ensure the platform’s security remains up to current standards.
Open Interest
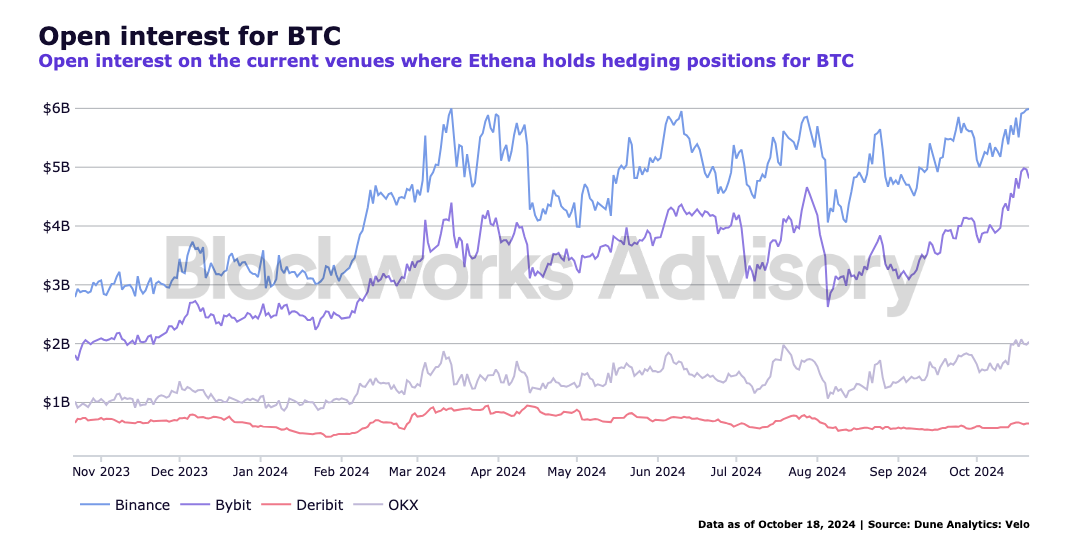
The following charts display the open interest trends over time for the relevant assets’ usd-margined contracts across the exchanges where Ethena currently holds positions. Additionally, we highlight Ethena’s current share of the total open interest on each exchange.
Total BTC open interest as of Oct 29, 2024 (11:00h):
| Exchange |
Ethena’s Position |
Total Open Interest |
Ethena’s Share (%) |
| Binance |
$996.18M |
$9.12B |
10.92% |
| Bybit |
$150.89M |
$6.44B |
2.34% |
| OKX |
$169.24M |
$3.65B |
4.64% |
| Deribit |
$48.86M |
$1.62M |
3.02% |
Total ETH open interest as of Oct 29, 2024 (11:00h):
| Exchange |
Ethena’s Position |
Total Open Interest |
Ethena’s Share (%) |
| Binance |
$348.45M (+$176.24M LSTs) |
$4.32B |
8.07% (12.15%) |
| Bybit |
$32.89M |
|
|
(+104.42M LSTs)|$2.23B|1.47% (6.16%)|
|OKX|$127.21M|$1.58B|8.05%|
|Deribit|$62.35M|$558M|11.17%|
SOL has been approved as an backing asset for USDe but positions have not yet been opened.
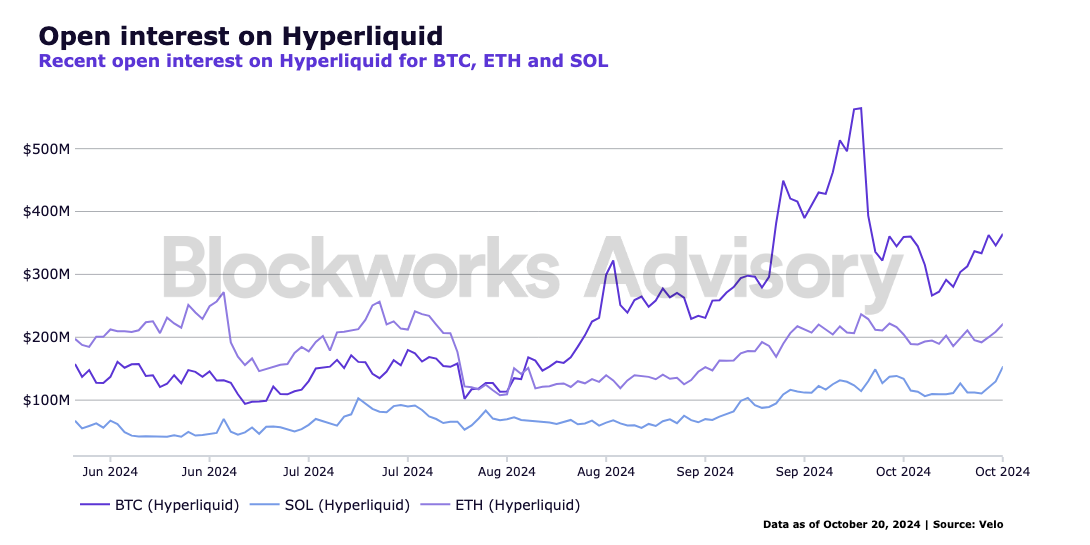
Hyperliquid is currently facing an uncertain period, with open interest inflated by expectations surrounding the TGE. Given this volatility and the funding rate analysis below, we advise starting with a conservative allocation of open interest, anticipating a decrease. The proposal suggests that Ethena’s maximum allocation should be set at 10% of Hyperliquid’s open interest for each asset, based on the open interest figures from October 15, 2024. We would recommend limiting this initial allocation to 7% and to be restricted to BTC and ETH.
Funding Rates
Funding rates are typically calculated based on the difference between the contract price and the spot price of the underlying asset, incorporating both an interest component and a premium component. Hyperliquid’s formula closely resembles those used by centralized exchanges. The interest rate component is fixed at 0.01% every 8 hours, translating to 0.00125% per hour, or an APR of 11.6% paid to shorts.
The premium component varies based on the difference between the perpetual contract price and the underlying spot oracle price. Given Hyperliquid’s lower volume and liquidity compared to centralized exchanges, this difference is expected to be more pronounced. The funding rate formula is as follows:
Funding Rate (F) = Average Premium Index (P) + clamp (interest rate - Premium Index (P), -0.0005, 0.0005)
Analyzing past funding rates on Hyperliquid provides insight into the real-world performance of this formula. However, it’s essential to evaluate Hyperliquid’s historical data with caution, as direct comparisons with competitors over the same timeframe may not be entirely fair. During the first three months of the mainnet closed alpha, which began in April 2023, trading on Hyperliquid incurred zero gas fees and zero trading fees. In June 2023, a fee structure was introduced, consisting of a flat 2.5 basis points (bps) for takers and a 0.2 bps rebate for makers, with referrers earning 10% of their referees’ taker fees. It wasn’t until March 2024 that the fee structure was revised to incorporate a rolling 14-day volume basis, implementing a tiered volume structure similar to that of centralized exchanges. For this analysis we’re considering data starting from September 2023.
The chart above clearly illustrates significant volatility in funding rates, particularly for SOL, which aligns with our expectations. Annualized funding rates for BTC have spiked higher than 200% in March 2024 and have been lower than 50% since May.
When comparing Hyperliquid’s funding rates against those of exchanges where Ethena currently holds positions, it is usually higher on any given day for all three assets.
An analysis of the funding rate differences also highlights that Hyperliquid generally maintains higher rates compared to other exchanges, indicated by a positive difference, above the clearly marked zero line. This trend is particularly pronounced during periods of high volatility, such as in March 2024, when Bitcoin experienced a sharp price increase.
Overall, the observed period shows an upward trend or relatively stable crypto prices, as shown in the chart. Notably, Hyperliquid has not yet operated under comparable conditions during a bear market. However, Ethena is proactively exploring various strategies to navigate such scenarios, such as closing hedging positions and moving this capital to RWAs, so that comparing exchanges’ performance over prolonged weak market conditions becomes less relevant.
Taking a closer look at the distribution of funding rates in the different exchanges over the last year, allows us to further measure this difference considering how summary statistics, autocorrelation and duration of funding spikes compare.
The average annualized funding rate on Hyperliquid is more than double that of Binance, and that of any other observed exchange, suggesting that Hyperliquid has had significantly higher funding rates over the observed period. OKX was excluded from the analysis because only weekly funding data was available for data older than three months. The median (the middle value) on Hyperliquid is higher than on any other exchange, though the gap is smaller than the difference in the mean. This suggests that, while Hyperliquid had a higher mean, the central tendency is not drastically different. Hyperliquid shows a much higher standard deviation, indicating greater variability in its funding rates compared to other exchanges. The funding rates on Hyperliquid are more spread out, meaning there are more extreme values or wider swings in rates. All exchanges exhibit leptokurtic distributions (kurtosis > 3), meaning the distributions have fat tails, with more extreme values or outliers compared to a normal distribution. Hyperliquid’s kurtosis is higher, suggesting it has more extreme outliers than other exchanges, although this value is similar to Bybit’s. All distributions are positively skewed (skewness > 0), meaning they have a long tail to the right. The Bybit funding rates are slightly more positively skewed, which is surprisingly indicating more frequent extreme positive values compared to Hyperliquid. This basically tells us within Bybit’s data, there are some values that are much higher compared to the typical funding rates in Bybit (which could still be lower in absolute terms than Hyperliquid’s).
We conducted a Mann-Whitney U test to compare the distribution of Hyperliquid’s funding rates with those of other exchanges. The results indicate a statistically significant tendency for Hyperliquid to consistently show higher funding rate values relative to other exchanges.
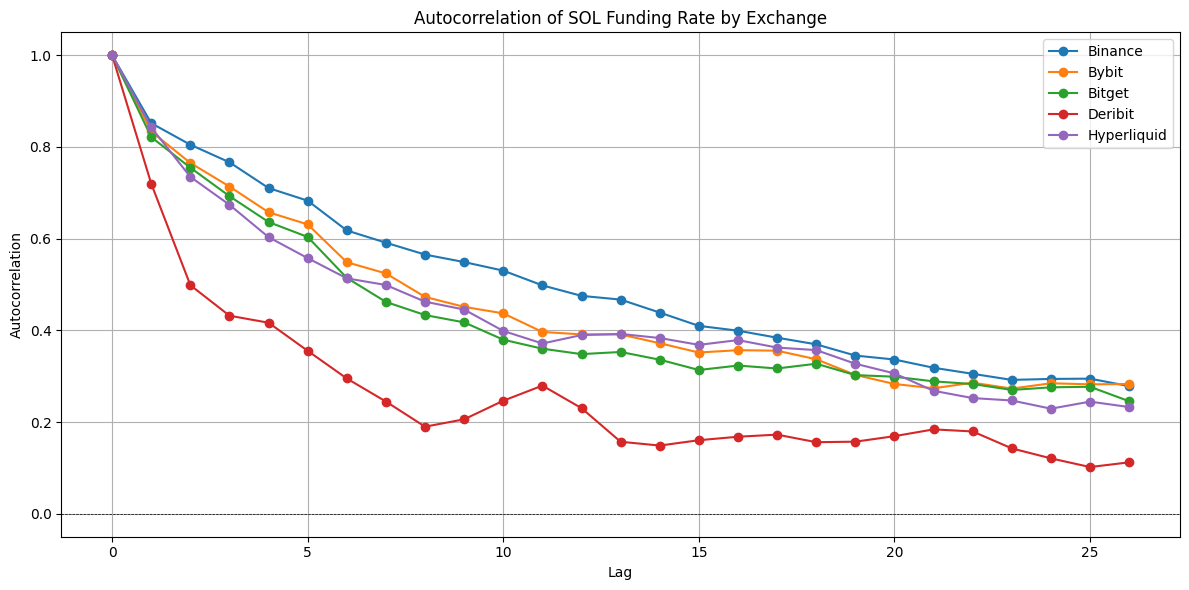
The autocorrelation chart displays how the funding rate correlates with its own past values at various time lags (in days). Values near 1 indicate a strong relationship, while values close to 0 suggest little to no correlation.
Among exchanges, Binance exhibits the highest persistence, with autocorrelation values staying high over more days. This implies that funding rates on Binance tend to change more gradually. Hyperliquid, though exhibiting low persistence, shows higher autocorrelation than Deribit, suggesting that while funding rate trends on Hyperliquid are less predictable than those on Binance or Bybit, they still tend to be more consistent than Deribit’s.
After having established that Hyperliquid’s funding rates are tendentially higher and display more variability, it is also relevant to consider how long spikes in funding rates last, in particular negative ones.
The charts below identify events when an exchange’s funding rate is significantly higher or lower than Binance’s average funding rate. We use Binance’s mean and standard deviation as a benchmark for all exchanges and count an event as significant for any exchange where the funding rate exceeds a threshold around Binance’s mean (more than 2 standard deviations above or below Binance’s mean).
We can observe the event duration and frequency. Long durations indicate persistent deviations from Binance’s threshold (e.g., funding rate remaining high or low relative to Binance). Higher frequency in specific duration ranges shows how often an exchange’s funding rate behaves differently than Binance. For instance, we can see that Hyperliquid has very frequent events that last one day and with some frequency some events lasting 2 and 5 days. There is even an event that lasted 18 days. However, these were all positive funding rate events where Hyperliquid’s funding rate was much higher than Binance’s average. Only on two occasions were there negative events, one lasting one day and another lasting four days.
ETH
The results for ETH align with previous findings and do not provide relevant additional insights, so we include them for completeness but omit detailed analysis.
SOL
Although the Risk Committee has approved the governance proposal to include SOL as a backing asset for USDe, conditions like maximum open interest and the selection of exchanges for SOL positions remain under review. As such, comparing Hyperliquid to other platforms on SOL funding rates is still preliminary, given that benchmark standards for SOL have not yet been established. This is underscored by the notably higher standard deviation observed across exchanges.
For the three assets, both mean and median are significantly larger on Hyperliquid, with the mean being much larger. This means that generally funding rates are larger and that, besides generally larger values, there are relevant spikes driving this average up. This aligns with the high positive skewness of all distributions. Standard deviations are also much higher implying there are more extreme funding rates (both high and low). All distributions are positively skewed, which checks out with our assumption that funding rates tend to be more positive than negative.
Autocorrelation analysis reveals that Hyperliquid’s funding rates are generally less persistent than those on other exchanges, indicating a higher level of unpredictability. However, it is not the least persistent among the group. When examining extreme event duration and frequency, we observe that Hyperliquid frequently experiences substantial positive funding rate spikes above Binance’s mean, with these positive spikes tending to be both longer and more frequent than negative ones. This characteristic makes Hyperliquid a promising choice for hedging strategies.
Conclusion
Based on our funding rate analysis, Hyperliquid presents a promising opportunity for Ethena to transition some of its positions on-chain. Given the current expectations of a possible decline and the unpredictable nature of open interest, we recommend limiting Ethena’s positions to 7% of open interest and limit opening positions at the beginning of this integration to BTC and ETH, which translates to $21.9M and $14.1M, respectively, at the time of writing.
This recommendation is pending the receipt and review of responses to the previously submitted questions on security and legal considerations. Importantly, we can only support this proposal if at least one new code audit is conducted on both the exchange and the underlying L1. While we acknowledge that moving hedging flows on-chain enhances transparency and that integrating USDe into Hyperliquid L1 adds valuable use cases for Ethena, we must prioritize the necessity of the audit. Therefore, we have conducted this comprehensive analysis to facilitate the implementation of this effort as soon as the pending audit is completed.