Ethena sUSDe Cooldown Reduction Analysis
Executive summary
Ethena currently applies a fixed 7-day unstaking period to sUSDe redemptions. This document analyses sUSDe unstaking dynamics and proposes a dynamic cooldown framework that sets the unstaking period each day based on available liquid backing relative to tail redemption risk. When Tier 1 assets (blue chip stablecoins and other same day liquid holdings) cover at least 1.5 times the p99 daily redemption benchmark, the cooldown is 1 day. As that coverage falls, the framework extends the window to 3 or 5 days automatically. The result is that users get the fastest possible redemption speed the protocol can safely support on any given day, rather than a fixed period calibrated to the worst case.
Applied to 799 days of history, the framework would have recommended a 1-day cooldown on roughly half of all days and a 7-day cooldown on the other half, with several intermediate states occurring in the second half of the observed period. The chart below shows this historical cooldown recommendation (including the queue pressure) alongside the distribution of tier 1, 2 and 3 and the coverage ratio that drives it. The two regimes are clearly visible with an early period where thin liquid backing required the full 7-day window, and a more recent period where a substantially larger and better structured Tier 1 supports same day redemptions. As of 10 March 2026 the framework recommends a 1-day cooldown, with Tier 1 coverage at 7.72x against the 1.5x threshold, the strongest position on record under the revised tier classification.


Background research
The analysis documented here is the third iteration of Blockworks Advisory’s work on sUSDe redemption design. The first analysis, conducted in early 2026, set out to answer a specific question, which is could Ethena safely shorten the sUSDe cooldown period from 7 days to 3 days without creating unacceptable liquidity risk? The answer was not a straightforward yes or no since neither a 7-day nor a 3-day fixed cooldown was the right instrument and the question itself pointed toward a different kind of framework.
The first analysis ran a counterfactual simulation imposing a 3-day cooldown on the observed history of unstake requests. Mechanically shortening the queue produced a mixed picture. Peak queue stocks fell by 12.4%, which is operationally attractive, but the tail of daily outflows widened slightly. The p99 one day outflow rose from 8.10% to 8.23% of supply, and the largest single day redemption event grew from 28.9% to 37.4% of supply due to timing effects. Large request batches that happened to mature three days before low inflow days produced outsized spikes that would not have appeared under the 7-day regime. The directional message was shortening the cooldown concentrates outflows, and the concentration is not trivial at the tail even if modest in expectation.
The more revealing finding came from the coverage analysis. Mapping USDe’s liquid backing against the 1.5x safety adjusted p99 redemption benchmarks, the protocol met the 3-day threshold on exactly zero of the 752 days in the sample. The modal recommendation under the original framework was a 7-day cooldown, required on 55.5% of days. The 3-day coverage ratio averaged 1.48x across the sample but with a median of only 0.89x, meaning on a typical day the protocol held less liquid backing than the threshold demands. That distribution is a sign of a system whose liquidity position moves enough, and fast enough, that the right cooldown length on any given day depends entirely on conditions that day.
This conclusion was reinforced by two other findings. First, the framework recorded 163 regime changes over the 752-day window, moments where the recommended cooldown switched from one length to another. Any static policy choice would have been misaligned with actual risk capacity on a large fraction of days. Second, the October 2025 stress episode, rather than being the point at which the system looked weakest, was actually the point at which coverage ratios looked strongest. During the 10-11 October window, 3-day coverage averaged 2.43x which is well above the 1.47x average in normal periods. The system appears to have mobilized liquid backing in response to pressure, a pattern consistent with precautionary rebalancing ahead of anticipated redemptions.
The regression analysis in the first report identified the sUSDe/USDe market premium as the dominant driver of deposit flows, explaining approximately 68% of net deposit variation. A 10 percentage point compression in the premium is associated historically with roughly $2.5 billion in outflows. By contrast, loop carry had no statistically significant direct effect on flows once the basis was controlled for. This has a direct implication for cooldown design where redemption pressure is not primarily a function of queue mechanics or carry arithmetic. It is primarily a function of whether the secondary market continues to price sUSDe at a premium to USDe. When that premium compresses sharply, the protocol needs to respond to large and rapid outflows regardless of what the cooldown setting is.
Taken together, these findings motivated moving from a static policy to a dynamic one. The framework that followed built on this conclusion directly. It condensed the classification of liquid stable backing from four settlement buckets to three tiers defined by redemption speed, with Tier 1 for same day liquid assets (blue-chip stables, mint/redeem balances, and USDtb in full at that stage), Tier 2 for assets redeemable within two days, and Tier 3 for utilisation constrained lending positions and ran the dynamic cooldown logic against 752 days of history. Two structural features of the system became clear. First, the cooldown distribution is strongly bimodal where 51.4% of days support a 1-day cooldown, 48.0% require the full 7-day window and only 0.7% fall in between. There is almost no middle ground. Second, this bimodal pattern is governed primarily by the share of Tier 1 in liquid backing. When Tier 1 falls below roughly 35% of the liquid pool the system drops into the low liquidity regime. When it holds above 50% the system sits comfortably in the high liquidity regime. The framework identified a Tier 1 target range of 45-55% as the structural requirement for consistent sub 3-day cooldowns, and the forecast scenarios confirmed that maintaining that allocation was more important than supply growth assumptions in determining tail outcomes. Nine regime transitions were recorded over the 752-day window which is a much smaller number than the regime change count in the original analysis, reflecting the cleaner three tier classification and a longer minimum holding period before a regime switch is confirmed.
The Risk Committee reviewed the framework and raised four specific questions that the current analysis addresses. The most substantive was the treatment of USDtb. The framework had classified the full USDtb balance in Tier 1 on the basis of two available redemption pathways, but the committee challenged whether both pathways actually generated net liquidity for the backing portfolio. That review led to the USDtb reclassification documented here, where only the 1% Anchorage instant cash buffer qualifies as Tier 1 and the remaining 99% moves to Tier 2 given the banking hours constraint on BUIDL replenishment. The committee also asked for 1-day coverage to be added as an explicit monitoring metric alongside the existing 3-day and 7-day horizons, for a queue pressure module that responds to actual unstaking activity rather than coverage alone, and for a concrete estimate of how many days the protocol can sustain a 1-day cooldown under different intensities of sustained outflow pressure. Those four additions are what this document describes.
Cooldown framework
This report documents four specific updates to the Ethena sUSDe dynamic cooldown framework, made in response to feedback from the Risk Committee. The original framework covered January 2024 through February 2026 and built a tier based liquidity classification system to recommend real time cooldown periods based on how much liquid backing was available at any given moment. The updates added (i) 1-day coverage as a monitoring metric alongside the existing 3-day and 7-day horizons, (ii) a queue pressure monitoring module that reacts to actual unstaking activity, (iii) a clearer treatment of how USDtb redemptions work and what that means for how we classify it and (iv) a stress testing that calculates how long the protocol can hold a 1-day cooldown under different intensities of sustained outflow pressure.
Where things stand right now, as of 10 March 2026, the protocol is in a strong liquidity position. 3-day coverage sits at 5.21x, 1-day coverage at 7.72x, and the framework recommends a 1-day cooldown. Total usable liquid backing is $5 billion against a USDe circulating supply of $5.93 billion, with $2.82 billion in Tier 1 assets available for same day redemptions. In practical terms, the protocol could absorb up to $1.88 billion of daily outflows (about 31.7% of supply) before needing to extend the cooldown. Under sustained p99 redemption pressure, Tier 1 holds for 11 consecutive days at normal stress intensity, 7 days at 1.5x that level, and 6 days at double intensity.
The framework sorts all liquid backing into three buckets based on how quickly each asset can actually be converted into stablecoins to meet redemptions, the tier composition is as discussed in the framework. Coverage ratios compare available liquidity against the p99 historical redemption benchmarks. Those benchmarks are 4.1% of USDe supply for the 1-day horizon, 9.2% for 3 days, and 12.0% for 7 days. We apply a 1.5x safety cushion throughout, so a 1-day cooldown requires Tier 1 to cover at least 1.5 times the p99 1-day benchmark, not just meet it exactly.
| Asset | Tier | Settlement | Rationale |
|---|---|---|---|
| USDC, USDT, PYUSD (exchange/custody) | 1 | Same day | Blue chip stables, instantly accessible |
| Mint/redeem contract balance | 1 | Same day | Already in protocol facility |
| USDtb (Anchorage instant buffer, 1%) | 1 | 15 min, 24/7 | $5-10M fiat buffer, no banking hours dependence |
| sDAI, sUSDS (yield bearing stables) | 2 | <2 days | Redeemable but not instant |
| Lending positions, withdrawable portion | 2 | <2 days | Confirmed withdrawable against current utilisation |
| USDtb BUIDL/Anchorage remainder (99%) | 2 | <2 day (banking hours) | app.40h/week replenishment constraint |
| Lending positions, utilisation constrained | 3 | <5 day | Withdrawal depends on pool utilisation dropping first |
The original coverage plot only showed 3-day and 7-day coverage. We added the 1-day coverage ratio to the plot. Under the revised tier classification, 1-day coverage is no longer systematically higher than 3-day coverage. Coverage 1d reflects Tier 1 only, while coverage 3d includes Tier 1 and Tier 2 combined, so when Tier 2 is large relative to Tier 1 (as it now is with most USDtb reclassified), the 3-day line can sit above the 1-day line depending on the relative size of Tier 2. The meaningful signal is whether 1-day coverage is above or below 1.5x, not its absolute level relative to the other lines.
| Metric | Coverage 1d | Coverage 3d | Coverage 7d |
|---|---|---|---|
| Mean | 1.93x | 1.94x | 1.58x |
| Median | 1.04x | 1.66x | 1.27x |
| 5th Percentile | 0.30x | 0.14x | 0.10x |
| 95th Percentile | 5.58x | 4.45x | 3.55x |
| Minimum | 0.00x | 0.00x | 0.00x |
| Maximum | 7.72x | 5.21x | 4.73x |
| Current (10 March 2026) | 7.72x | 5.21x | 4.73x |
The existing framework makes its cooldown recommendation based purely on how much liquid backing is available at that moment. The committee wanted something that also responds to what is actually happening in the redemption queue, specifically, is unstaking activity accelerating in a way that suggests a stress event is building? The design had to satisfy three conditions: only increase cooldowns when redemptions are actively materialising, avoid triggering so frequently that users experience constant cooldown changes and escalate immediately and decisively when something genuinely extreme happens.
We compute a queue pressure ratio, today’s unstaking requests divided by the 14-day rolling average. If that ratio exceeds 2.0x (meaning today is seeing double the recent run rate) and the 3-day coverage ratio is below 1.5x at the same time, the cooldown recommendation gets bumped up by one day. If two or more consecutive days unstaking breach the historical p95 level of daily outflows, the cooldown jumps straight to 3 days regardless of coverage, that is the hard escalation trigger. The histogram below shows the shape of the daily pressure ratio distribution across the full sample. The vast majority of days cluster near zero, the protocol experiences normal or below average unstaking on most days. The distribution has a pronounced right tail, however, with a p95 of 5.42x and a maximum of 20.0x, confirming that extreme pressure events do materialise and are fat tailed. Surge days (ratio above 2.0x) accounted for 127 observations, or 15.9% of the sample (roughly one in six days) while the p95 hard escalation threshold was breached in 10 days (1.3%).

The committee had questions about whether USDtb really belongs in Tier 1. The concern was whether the reliance on Anchorage Digital Bank as issuer and custodian introduces enough friction to downgrade its settlement speed. After reviewing the documented redemption architecture, the conclusion is that only the Anchorage instant cash buffer (1% of USDtb supply) qualifies as Tier 1 and the remainder is classified as Tier 2 given the banking hours constraint of BUIDL replenishment.
The atomic swap path is available 24/7 to all Ethena onboarded mint/redeemers. It works in two atomic transactions using USDtb to mint USDe (one Ethereum block, roughly 12 seconds), then redeem USDe for USDC or USDT (another block). Total round trip under 24 seconds, 4 basis points all in, no Anchorage account required. This path applies to external holders of USDtb where the USDtb is held outside of the USDe backing. For USDtb already held as USDe collateral, the same transaction would be circular and does not generate net liquidity.
The Anchorage fiat path is for users with Anchorage accounts and works as follows: deposit USDtb with Anchorage (instant credit), receive fiat USD within 15 minutes, 24/7/365. A 1% cash buffer (approximately $10 million at $800 million supply) is held for continuous same day availability, with larger amounts replenishable from BUIDL redemptions within hours on US banking days (executable app. 40 hours per week).
The $10 million Anchorage instant cash buffer qualifies as Tier 1 on the basis of 24/7 availability. The remainder of the USDtb balance is classified as Tier 2, given that replenishment above the buffer required BUIDL redemption during US banking hours.
The redemption cap analysis is the most practically useful addition. It converts the abstract coverage ratios into a concrete operational question, if outflows come in at p99 intensity and do not stop, how many days of Tier 1 runway do we have before the coverage threshold is breached and we need to extend the cooldown? This is the number the operations team actually needs to plan around.
We estimated the daily redemption cap as the maximum daily outflow Tier 1 can absorb while still staying above the 1.5x threshold (Tier 1/ 1.5). Across the full 799 day sample, the mean daily redemption cap is $514.4 million, or 7.9% of supply. That average is pulled down substantially by Phase 1, when Tier 1 was minimal. At the October 2025 peak the cap reached $2.7 billion. Today it sits at $1.88 billion, equivalent to 31.7% of supply, meaning the protocol can currently absorb an outflow event approximately 2.6 times the size of the largest single day unstaking observed in the historical data (approximately $714 million) before needing to consider a cooldown extension.
| Metric | Value |
|---|---|
| Mean daily redemption cap | $514.4M (7.90% of supply) |
| Minimum daily cap | $0.0M (early Phase 1) |
| Maximum daily cap | $2,702.7M (October 2025 peak) |
| Current cap (10 March 2026) | $1,876.5M (31.65% of supply) |
| Current cap vs largest single day outflow | 2.6x larger |

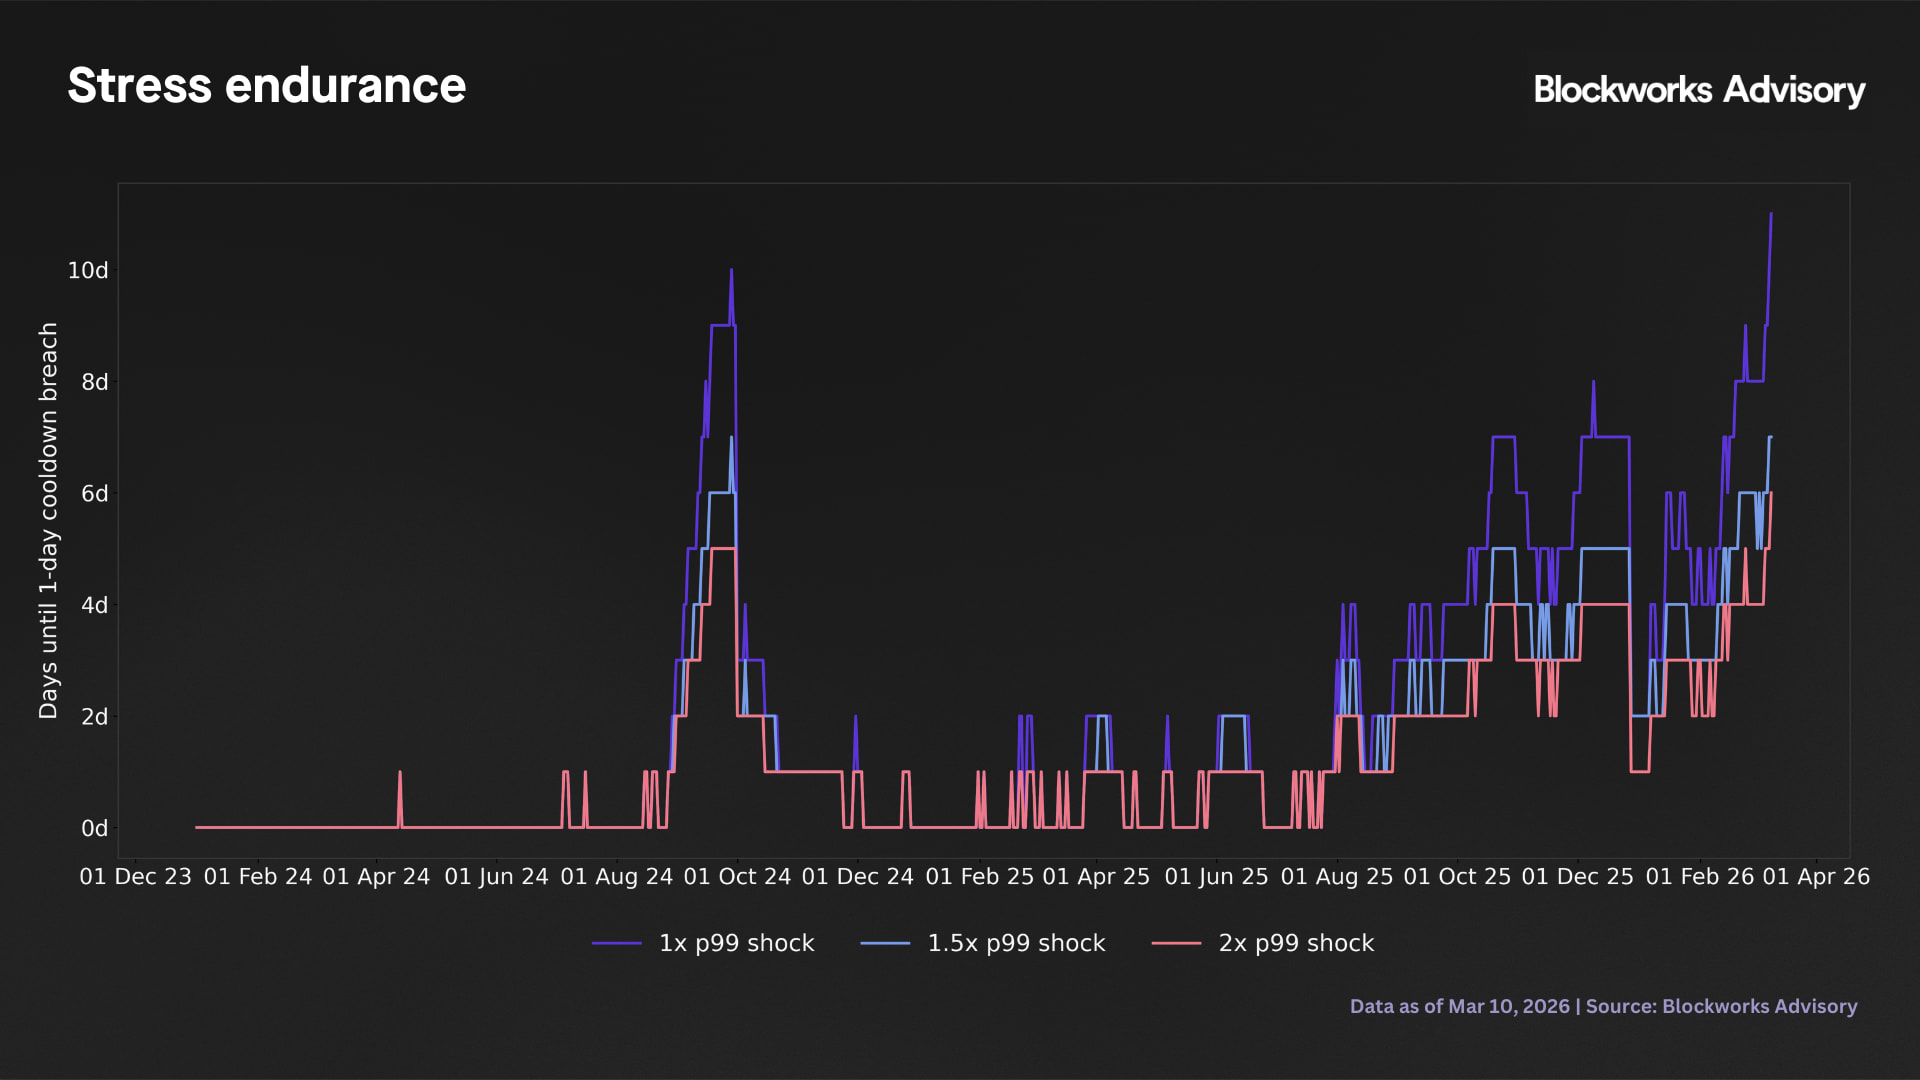
The stress endurance simulation takes this further. Starting from each historical date, it progressively drains Tier 1 by a fixed daily amount (calibrated at 1x, 1.5x, or 2x the p99 1-day benchmark) and counts how many days pass before coverage falls below the safety floor. The simulation caps at 365 days. Three shock levels are tested, normal stress (4.1% of supply per day), elevated stress (6.15%), and severe stress (8.2%). The result is a time varying estimate of protocol endurance that moves with Tier 1 balances.
Right now, if the protocol were hit by continuous p99 level redemption pressure (roughly 4.1% of supply per day, every day) Tier 1 would hold the 1-day cooldown threshold for 11 consecutive days before an extension became necessary. Pump that pressure up to 1.5x p99 and the runway shortens to 7 days. At double p99 intensity, it is 6 days.
| Stress Scenario | Daily Drain | Mean Endurance | Median Endurance | 5th Pct | Current Runway |
|---|---|---|---|---|---|
| Normal (1x p99) | 4.1% of supply/day | 1.4 days | 0 days | 0 days | 11 days |
| Elevated (1.5x p99) | 6.15% of supply/day | 0.9 days | 0 days | 0 days | 7 days |
| Severe(2x p99) | 8.2% of supply/day | 0.6 days | 0 days | 0 days | 6 days |
The historical mean endurance of 1.4 days at normal intensity mostly reflects Phase 1, when Tier 1 was already below the threshold on many days and endurance started at zero. Phase 3 tells a much better story with the October 2025 stress episode (the most significant historical reference point) produced an average endurance of 4.6 days at 1x p99 intensity, meaning even during that stress episode the protocol had nearly a week of runway before a cooldown extension would have been required. The current 11-day endurance is the strongest position observed under the revised Tier 1 classification.
The 5th percentile of 0 days across all scenarios is worth explaining since those are Phase 1 observations where Tier 1 was already below the coverage threshold on the observation date, so the endurance was zero by definition before any additional stress was even applied.