Ethena Aave Integration: Dynamic Safe Cap Model
Executive Summary
This analysis presents a comprehensive stress testing framework for determining optimal Aave lending caps for USDe’s liquid backing assets. The model dynamically calculates maximum safe lending amounts under various redemption stress scenarios while maintaining adequate liquidity for user withdrawals.
Key Takeaways
- Redemptions are predictable and largely contained. Historical redemptions have been modest relative to total supply and are largely driven by Pendle PT expiries (scheduled) and occasional market shocks, not by yield fluctuations. Negative USDe yield spreads correlate with increased redemptions, but with lag and smoothing effects due to sUSDe’s cooldown and sticky capital.
- Structural scenarios can constrain lending. While all past redemption levels are manageable even under extreme Aave stress, theoretical structural shocks, like simultaneous redemptions of floating USDe + near-maturity Pendle, can reduce safe Aave caps.
- Dynamic stress-responsive framework: The model scales historical redemption data to current supply, applies time-based weighting to Pendle risk, and flexibly adjusts recommended caps as supply composition shifts.
- Recommended allocation range: Under current conditions, a 49% cap on liquid stables in Aave is advised. The range of 35-60% remains robust across realistic input variations. This is dependent on a large buffer of liquid stables being readily available to honor redemptions.
- When to adjust caps: Decrease allocations if floating USDe rises >$4B, Pendle maturities shorten (<5d), liquid backing drops < $6B, or Aave utilization exceeds 90%.
Increase if more USDe moves to sUSDe, Pendle maturities extend, or liquid backing exceeds $8B.
Redemption Stress
There are several important considerations when assessing redemption stress. Ethena must always maintain a sufficient buffer of liquid stablecoins to honor redemptions quickly and reliably. This is critical to avoid pressure on USDe’s peg. To size this buffer appropriately, we need to understand how large redemptions tend to be, and what drives them. Identifying these drivers allows us to build them into our models and adjust expectations dynamically as conditions change.
Redemptions and Yield Dynamics
Hypothesis: Lower yields lead to higher redemptions.
Since the primary use case for USDe is to earn yield via sUSDe, periods of low yields can incentivize users to redeem and reallocate their capital elsewhere. To capture this effect, we benchmark USDe yields against the median sDAI yield, and observe how redemptions behave when the USDe–sDAI yield spread turns negative.
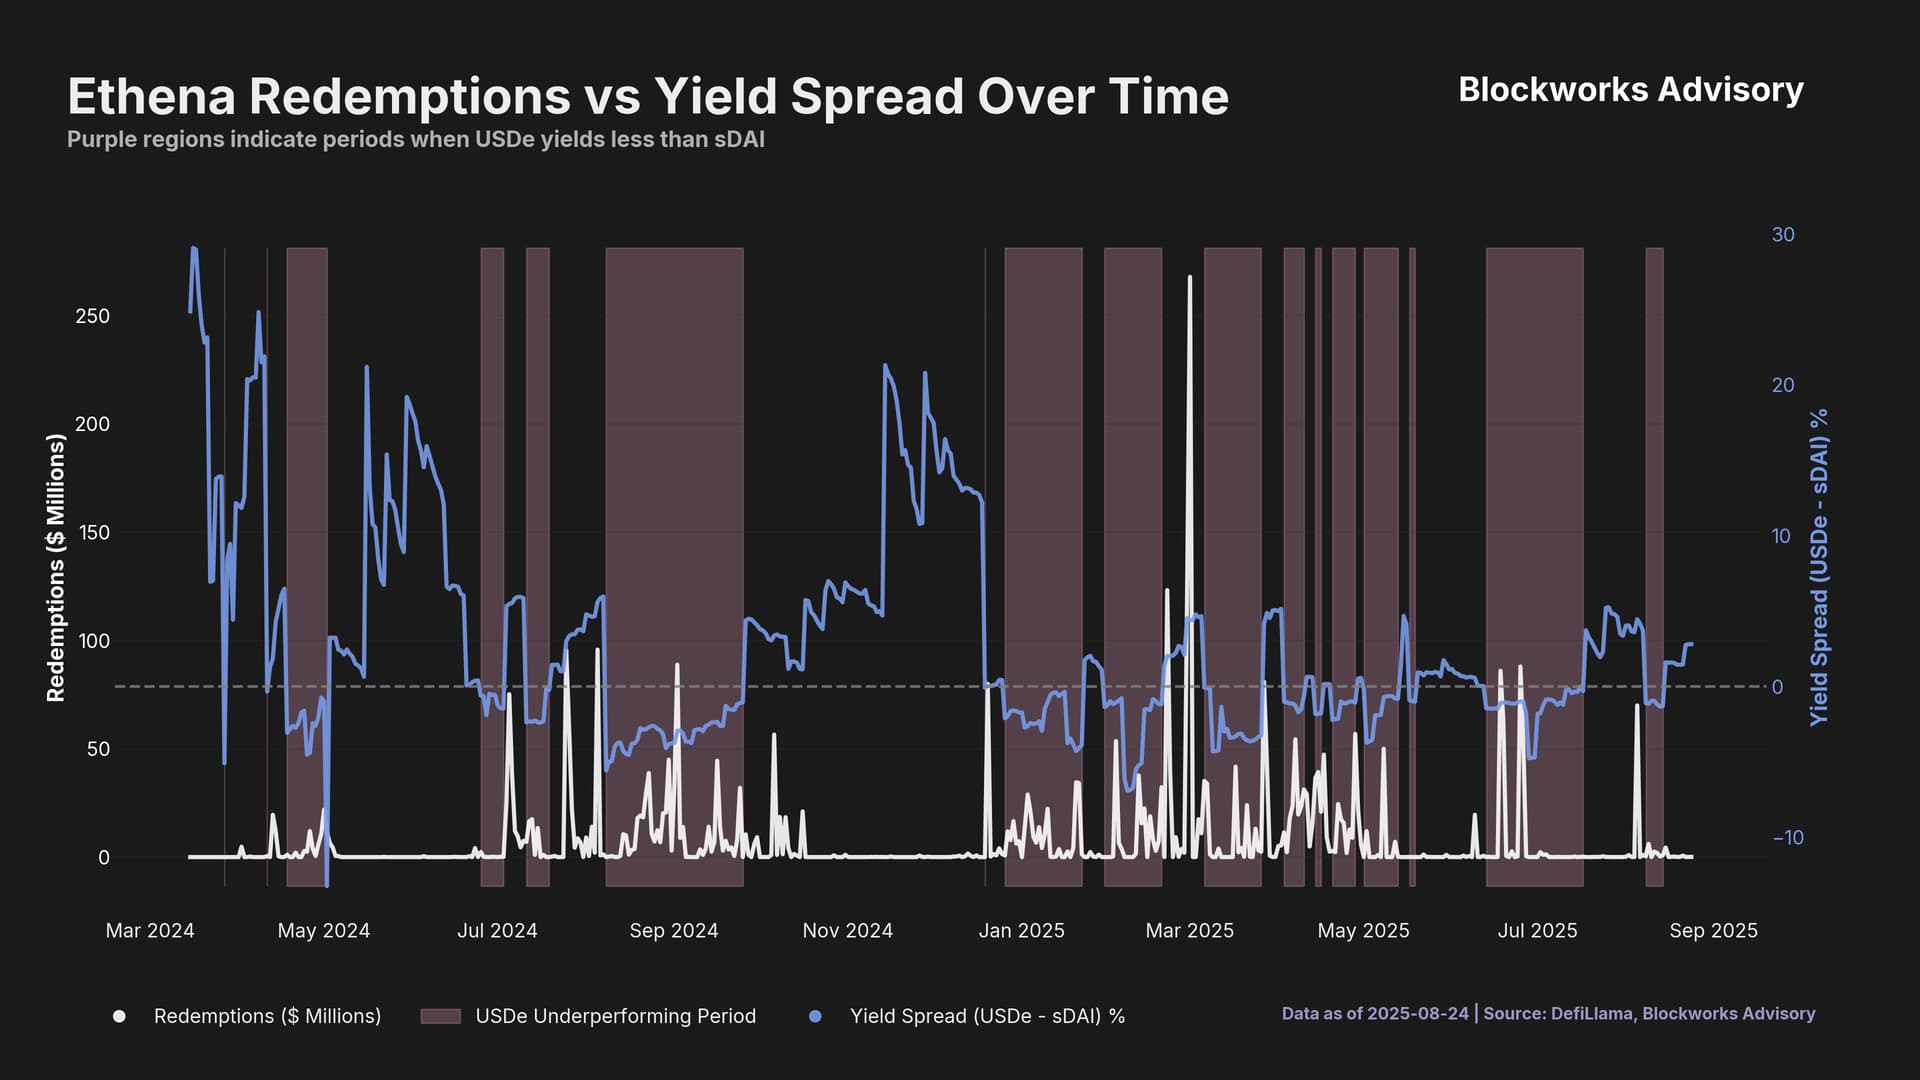
Looking at the chart above, it’s clear that redemptions are rare during periods when USDe yields outperform the benchmark (non-shaded areas). However, redemptions don’t align perfectly with yield shifts, for two main reasons:
-
Cooldown period: Yield is captured via sUSDe, which has a 7-day unstaking cooldown. Sophisticated users may anticipate falling yields, but there’s typically a lag between when yields become less attractive and when redemptions actually occur.
-
Sticky capital: Large holders often have strategic relationships with Ethena and may tolerate short periods of uncompetitive yields. They usually only redeem after more prolonged periods of unattractive returns, rather than reacting immediately.
This behavior means redemption activity is partly lagged and smoothed, rather than reacting mechanically to yield changes in real time.
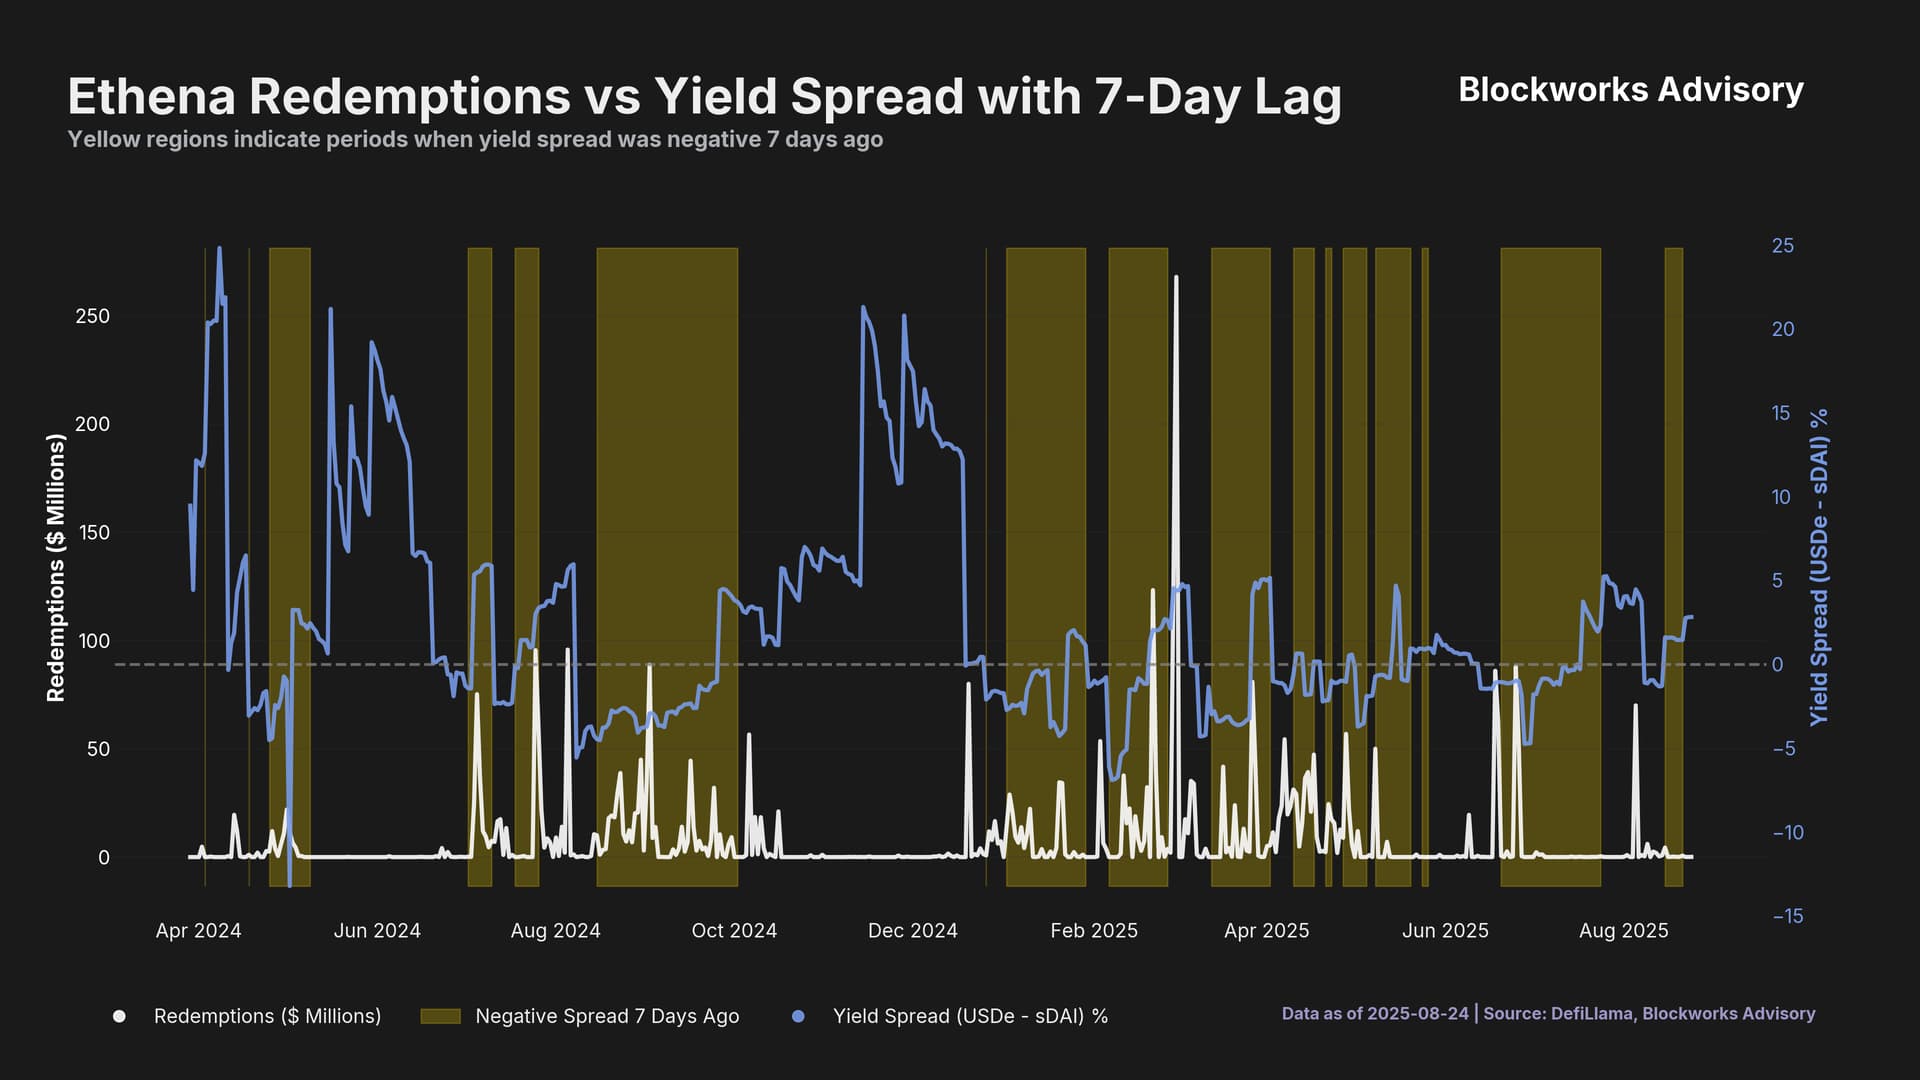
The chart above plots redemptions alongside the USDe–sDAI yield spread, with orange shading marking periods when the spread had been negative seven days earlier to account for the sUSDe cooldown period. While this approach isn’t perfectly precise (as it only uses sDAI as a benchmark and doesn’t capture all alternative yield opportunities), it still highlights the pattern well: when the yield spread is elevated, as it was from May to July 2024, and again from November 2024 through January 2025, redemptions remain minimal.
That said, there are also several redemption spikes that don’t align with low-yield periods, suggesting that other factors were at play. These outliers warrant further investigation to identify their underlying causes.
Redemptions and Pendle Expiries
Pendle expiries appear to be one of the primary drivers of large redemption spikes, and unlike yield-driven outflows, they occur in a scheduled and predictable manner rather than being triggered by market conditions.
Recent Pendle expiry dates include:
- 2024-04-04 (USDe only)
- 2024-04-25 (sUSDe only)
- 2024-07-25 (USDe + sUSDe)
- 2024-09-26 (sUSDe only)
- 2024-10-24 (USDe + sUSDe)
- 2024-12-26 (sUSDe + USDe)
- 2025-02-27 (sUSDe only)
- 2025-03-27 (USDe + sUSDe)
- 2025-05-29 (eUSDe + sUSDe)
- 2025-07-31 (sUSDe + USDe)
- 2025-08-14 (eUSDe only)
The chart below overlays dotted vertical lines marking these expiry dates and shows redemptions as a percentage of total USDe supply rather than absolute amounts.
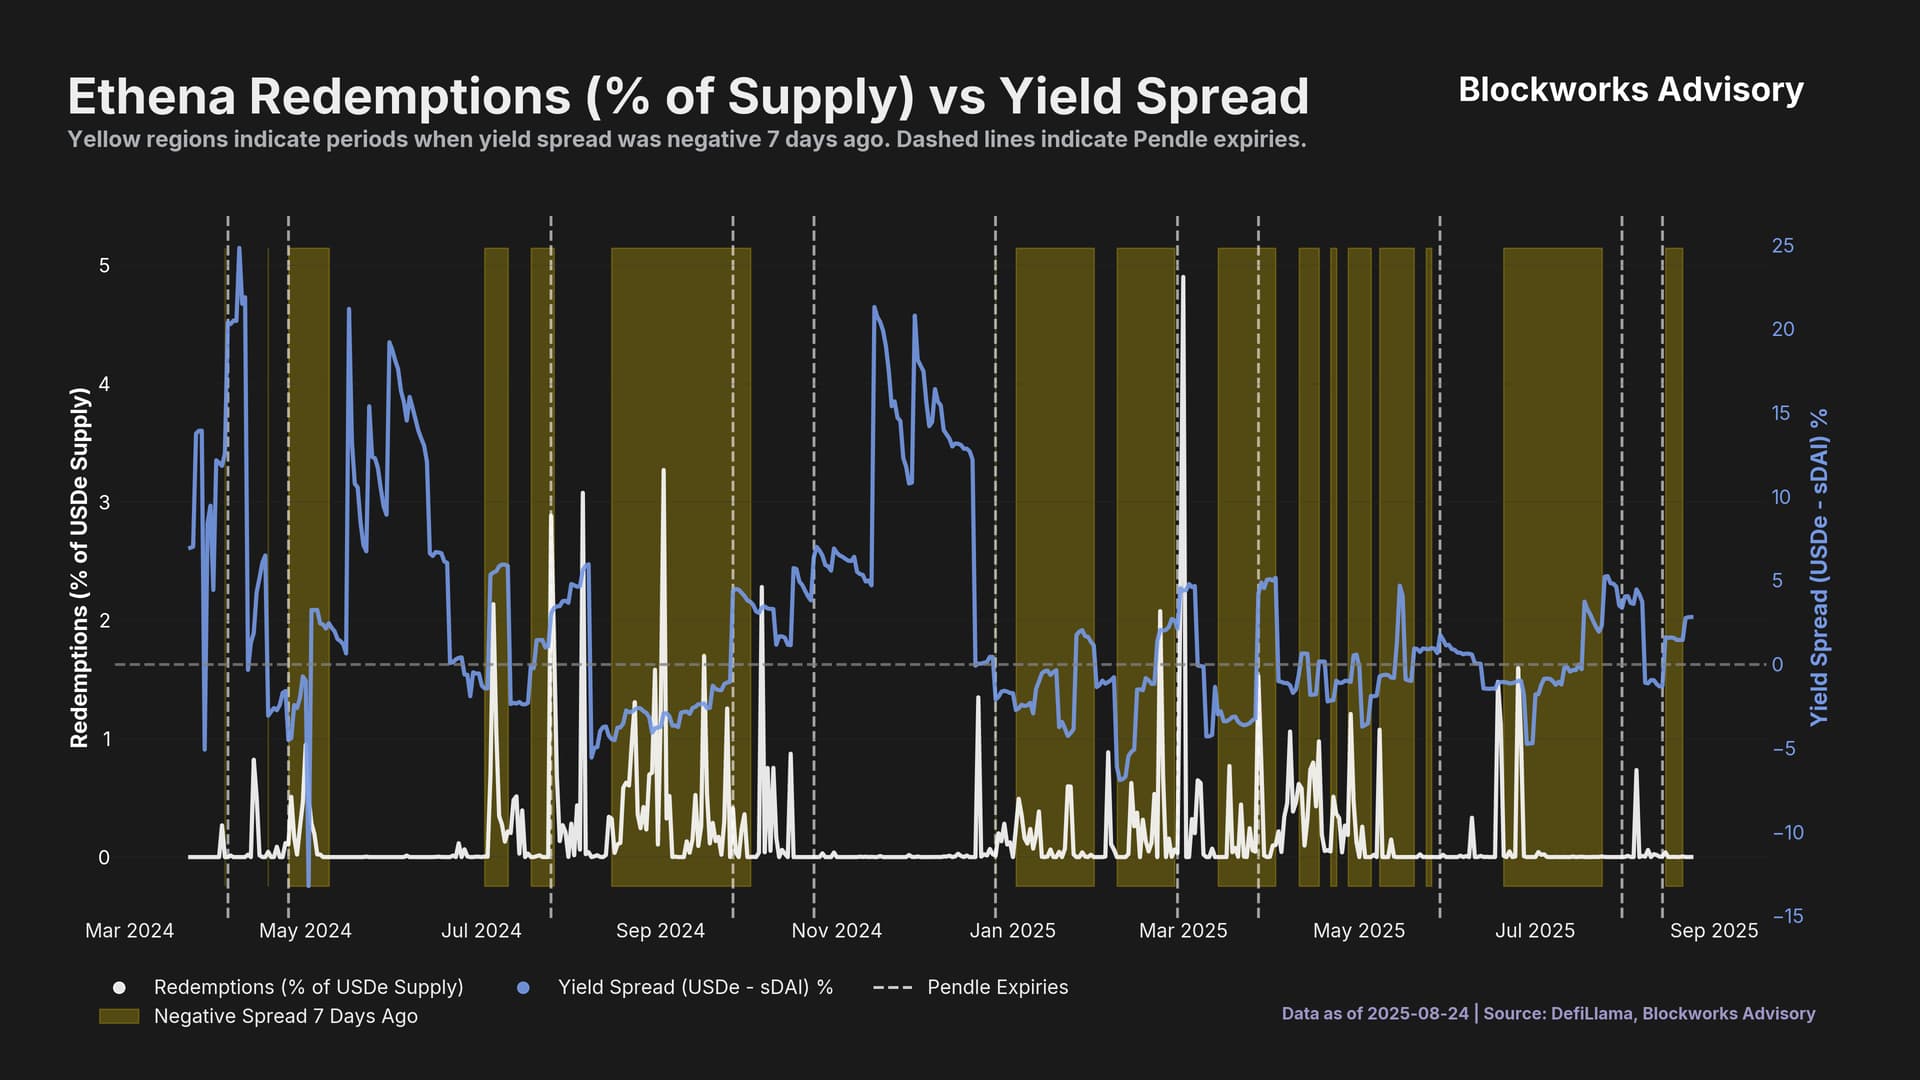
When viewed alongside yield spread data, most redemption spikes can be explained by either Pendle expiries or periods of low (or negative) yield spreads. Very few redemptions fall outside these two categories, suggesting that Pendle maturities and yield conditions are the key predictors of redemption activity.
Redemptions - Top 10 analyzed
The ten largest redemption events together accounted for $1.13B, averaging $113M per event, and represent the most significant moments of liquidity outflow in USDe’s history. These redemptions often clustered around two types of conditions: Pendle PT expiries and sharp market dislocations.
Pendle expiries were the dominant driver. Six out of the ten events occurred within a week of a major Pendle maturity date, suggesting that redemptions were primarily driven by investors rotating out of maturing PT positions. The largest single event, on March 1, 2025, saw $267.9M (4.9% of supply) redeemed just two days after a major Pendle tranche expired. This was immediately preceded by another large redemption on February 28 ($125M, 2.2%) and followed earlier by February 21 ($123.3M, 2.1%), both also near the same expiry window. Notably, this aligned with the Bybit hack, which briefly shook confidence among USDe holders, and was most likely the main driver of these redemptions. Other Pendle-driven outflows included July 25, 2024 ($95.5M, 2.9%), March 27, 2025 ($80.9M, 1.5%), and December 20, 2024 ($80M, 1.35%).
By contrast, the remaining redemptions appear to have been driven by market stress. The remaining four redemptions were linked to broader market volatility and negative sentiment rather than yield arbitrage. On August 5, 2024, $95.8M (3.1%) was redeemed as BTC plunged 15%, breaking below $50K for the first time in months. Similarly, September 2, 2024 saw $88.8M (3.3%) redeemed amid a sustained negative yield spread. More recently, June 25, 2025 ($88M, 1.6%) and June 18, 2025 ($86M, 1.5%) occurred during low or negative spreads and heightened geopolitical risk, as broader markets were bleeding.
Yield conditions shaped the environment in which these redemptions occurred. Interestingly, most of these major outflows (7 of 10) occurred during periods of positive yield spreads, when redemption was less financially attractive. This reinforces the idea that timing of Pendle maturities, rather than purely yield-driven incentives, was the stronger catalyst. Negative-spread periods did coincide with some redemptions, especially September 2, June 25, and June 18, which were not around Pendle maturities but were more likely triggered by external market shocks.
| Date | Amount | % of Supply | Yield Spread | Near Pendle Expiry? | Context / Notes |
|---|---|---|---|---|---|
| 2025-03-01 | $267.9M | 4.903% | 4.3896% | Yes — 2d after 2025-02-27 | Largest redemption on record; clustered around Pendle expiry and around 8 days after Bybit hack |
| 2025-02-28 | $125.0M | 2.174% | 4.5412% | Yes — 1d after 2025-02-27 | Follow-up redemption during same expiry window and around 7 days after Bybit hack |
| 2025-02-21 | $123.3M | 2.079% | 2.0523% | Yes — 6d before 2025-02-27 | Bybit hack (and pre-expiry unwind) |
| 2024-08-05 | $95.8M | 3.078% | 5.6204% | No | BTC dropped 15% below $50K — risk-off market |
| 2024-07-25 | $95.5M | 2.885% | 3.0083% | Yes — same day (2024-07-25) | Major Pendle expiry |
| 2024-09-02 | $88.8M | 3.271% | −2.9237% | No | Negative yield spread persisted |
| 2025-06-25 | $88.0M | 1.597% | −0.9822% | No | Negative spread; geopolitical turmoil |
| 2025-06-18 | $86.0M | 1.481% | −1.0870% | No | Negative spread; markets broadly bleeding |
| 2025-03-27 | $80.9M | 1.527% | 4.1842% | Yes — same day (2025-03-27) | Pendle expiry |
| 2024-12-20 | $80.0M | 1.350% | 0.0387% | Yes — 6d before 2024-12-26 | Pendle expiry |
Model Overview
Core Problem
Ethena deploys USDe’s liquid stablecoin backing (USDC/USDT) across multiple venues, including Aave lending markets. The challenge is determining how much can be safely lent on Aave while preserving the ability to meet redemption demands under stress conditions.
Key Question
What is the maximum amount of liquid backing that can be lent on Aave while maintaining sufficient liquidity to handle redemption shocks?
Mathematical Framework
Core Formula
The model is built around a fundamental liquidity constraint:
Available Liquidity Under Stress ≥ Redemption Shock
Available Liquidity = (Ltotal - A) + h × A = Ltotal - (1-h) × A
Amax = (Ltotal - S) / (1-h) Where:
• A = Amount lent on Aave
• Ltotal = Total liquid stablecoin backing
• S = Redemption shock amount
• h = Aave withdrawable fraction under stress (0 ≤ h ≤ 1)
• Amax = Maximum safe Aave lending amount
Key Insight: The model recognizes that under stress conditions, only a fraction h of Aave deposits may be quickly withdrawable, while off-Aave liquidity remains fully accessible.
Model Inputs and Assumptions
1. USDe Supply Structure
| Component | Amount | Description |
|---|---|---|
| Total Supply | $12.48B | Total USDe in circulation |
| sUSDe (Staked) | $5.64B | Excluded from immediate redemption due to 7-day cooldown |
| Pendle Total | $4.18B | Time-weighted based on maturity |
| Floating USDe | $2.66B | Immediately redeemable |
2. Liquid Backing Composition ($6.9B Total)
| Component | Amount | Description |
|---|---|---|
| Current Aave Deposits | $2.8B | Currently lent on Aave |
| Copper Buffer | $0.8B | Custody buffer |
| Mint/Redeem Contracts | $30M | Operational contracts |
| Replenisher Wallet | $0.5B | Protocol operations |
| Unspecified Off-Aave | $2.6B | Other liquid venues (USDtb, idle USDC, etc) |
3. Stress Parameters
Aave Withdrawable Fractions (h)
The model tests eight stress levels representing the percentage of Aave deposits withdrawable during crisis:
| Fraction | Description | Stress Level |
|---|---|---|
| 0.0 (0%) | Complete Aave liquidity freeze | Maximum stress |
| 0.01 (1%) | Extreme stress (99% haircut) | Extreme stress |
| 0.05 (5%) | Severe stress (95% haircut) | Severe stress |
| 0.1 (10%) | High stress (90% haircut) | High stress |
| 0.2 (20%) | Moderate-high stress (80% haircut) | Moderate-high stress |
| 0.4 (40%) | Moderate stress (60% haircut) | Moderate stress |
| 0.6 (60%) | Low stress (40% haircut) | Low stress |
| 0.8 (80%) | Minimal stress (20% haircut) | Minimal stress |
Redemption Shock Scenarios
Historical Shocks (Based on actual redemption data as % of supply):
- P95 Historical: $115.8M (95th percentile daily redemption scaled to current supply)
- P99 Historical: $270.0M (99th percentile daily redemption scaled to current supply)
- Max Historical: $611.9M (Maximum historical daily redemption scaled to current supply)
Structural Shocks:
- All Floating USDe: $2.66B (All immediately redeemable USDe)
- Structural Combined: $3.84B (Floating USDe + Effective Pendle Demand)
4. Pendle Position Treatment
Step Function Risk Assessment
Pendle Principal Tokens (PTs) containing USDe are weighted by time-to-maturity using a discrete step function reflecting realistic user redemption behavior:
| Days to Maturity | Redemption Probability | Rationale |
|---|---|---|
| ≤ 5 days | 30% | Immediate pressure – users actively redeem |
| 6–10 days | 20% | High pressure – preparation for redemption |
| 11–20 days | 10% | Moderate pressure – some early redemptions |
| > 20 days | 0% | Minimal pressure – users wait closer to maturity |
Current Pendle Position: $4.18B total with effective demand of ~$858M (20%)
Rationale:
- Eliminates daily volatility in redemption estimates
- Based on realistic user behavior patterns
- Only near-maturity positions contribute meaningful immediate risk
- Provides operational predictability and risk management clarity
This heuristic was chosen because historical data did not provide conclusive or actionable insights on user behavior near maturity. Over the past two months, USDe in PTs has grown so rapidly that relying on historical patterns was deemed inappropriate, as illustrated in the chart below.

5. Key Assumptions
- Historical Scaling: Past redemption patterns (as % of supply) are indicative of future stress scenarios
- Stress Independence: Aave liquidity stress and redemption shocks can occur simultaneously
- Off-Aave Liquidity: Non-Aave liquid assets remain fully accessible under stress
- Pendle Behavior: Time-to-maturity is the primary driver of redemption likelihood
- Operational Continuity: Model assumes continued operation under stress (no protocol shutdown)
Scenario Results Analysis
Historical Scenarios (Manageable Stress)
All historical shock scenarios ($116M - $612M) show minimal impact on Aave lending capacity:
- Even under severe Aave stress (0% withdrawable), caps remain >90% of liquid capacity
- Demonstrates that historical redemption patterns are well within operational bounds

Sensitivity Analysis Across Input Variations
To validate robustness, the model was tested across six different input scenarios representing realistic changes in USDe composition and market conditions:
| Scenario | Key Changes | Aave Cap Range (% at 1% withdrawable) | Robustness |
|---|---|---|---|
| Base Case | Current actual values | 49% capacity | Baseline |
| High Floating USDe | +$2B more floating USDe | 34% capacity | More constrained |
| Low Floating USDe | More locked in sUSDe/Pendle | 90% capacity | Less constrained |
| High Pendle Exposure | +$2B Pendle, shorter maturity | 38% capacity | More constrained |
| Low Liquid Backing | -20% total liquid backing | 34% capacity | More constrained |
| Conservative Structure | More sUSDe, less Pendle | 63% capacity | Less constrained |
Key Sensitivity Insights:
- Base allocation range: 30-50% works across most realistic scenarios under extreme Aave stress
- Conservative scenarios allow 60-90% allocation when USDe structure is favorable (more sUSDe, less floating)
- Worst-case scenarios limit to ~35% when multiple stress factors combine (high floating USDe + reduced backing)
- Most vulnerable to: Higher floating USDe, shorter Pendle maturities, reduced liquid backing
- Most resilient to: More conservative USDe composition (higher sUSDe proportion)
Structural Scenarios (Significant Stress)
All Floating USDe ($2.66B shock):
| Aave Withdrawable | Cap Amount | % of Liquid Total |
|---|---|---|
| 0% | $4.24B | 61% |
| 20% | $5.30B | 77% |
| 40%+ | $6.90B | 100% (No constraint) |
Structural Combined ($3.84B shock):
| Aave Withdrawable | Cap Amount | % of Liquid Total |
|---|---|---|
| 0% | $3.06B | 44% |
| 20% | $3.83B | 55% |
| 60%+ | $6.90B | 100% (No constraint) |
Model Strengths
- Dynamic Framework: Adapts to changing supply levels and market conditions
- Comprehensive Stress Testing: Covers both historical and structural shock scenarios
- Realistic Assumptions: Incorporates time-based risk weighting for complex positions
- Granular Analysis: Tests wide range of stress severities
- Data-Driven: Uses actual historical redemption patterns scaled to current protocol size
Model Limitations
- Correlation Assumptions: May underestimate correlations between Aave stress and redemption demand
- Historical Dependence: Future stress may exceed historical patterns
- Static Pendle Weighting: Actual redemption behavior may vary from modeled decay function
- Operational Assumptions: Assumes continued access to off-Aave liquidity under extreme stress
- Binary Liquidity View: Reality may involve partial/delayed access rather than binary availability
Key Conclusions
1. Historical Redemptions Are Manageable
Even the largest historical redemption patterns (scaled to current supply) create minimal constraints on Aave lending capacity, suggesting robust operational resilience.
2. Structural Risks Require Careful Management
Scenarios involving significant floating USDe redemptions combined with Pendle position unwinding can meaningfully constrain Aave lending capacity, particularly when Aave itself experiences liquidity stress.
3. Critical Risk Threshold
The model identifies 60% Aave withdrawable fraction as a threshold below which structural shocks need to be watched closely. Below this level, Aave lending capacity could become constrained.
4. Pendle Maturity Risk
Time-to-maturity analysis shows that Pendle expiries (21 days) can contribute meaningful stress, highlighting the importance of monitoring maturity concentration.
5. Operational Buffer Importance
The difference between “All Floating USDe” and “Structural Combined” scenarios ($1.2B) demonstrates the significant incremental risk from Pendle positions, supporting the value of operational buffers.
6. Recommended Aave Allocation
Based on the model results and sensitivity analysis, we currently recommend allocating a maximum of 49% of liquid stables to Aave under current conditions. The range of 35-60% remains robust across realistic input variations.
| Risk Profile | Recommended Allocation | Rationale | Sensitivity-Adjusted |
|---|---|---|---|
| Conservative | 30-40% of liquid stables | Safe even under extreme Aave stress (1% withdrawable). Handles worst-case scenarios. | Works in all tested scenarios |
| Moderate | 40-60% of liquid stables | Assumes moderate Aave stress resilience (10-20% withdrawable). | Safe unless extreme structural changes |
| Aggressive | 60-80% of liquid stables | Assumes Aave maintains reasonable liquidity (40%+ withdrawable). Higher yield but requires favorable USDe structure. | Only suitable with conservative USDe composition |
Dynamic Adjustment Framework:
- Decrease allocation by 10-15% if:
- Floating USDe increases significantly (>$4B)
- Pendle positions approach shorter maturities (<14 days)
- Total liquid backing decreases (<$6B)
- Aave utilization rates exceed 90%
- Increase allocation by 5-10% if:
- More USDe moves to sUSDe (longer lock-up)
- Pendle maturities extend (>30 days)
- Liquid backing grows substantially (>$8B)
- Aave markets remain consistently liquid
Monitoring Triggers for Reallocation:
- Structural changes: >20% change in floating USDe composition
- Pendle concentration: >50% of Pendle exposure maturing within 14 days
- Market conditions: Aave utilization >95% or major liquidity events
- Growth scenarios: Total supply growing >25% quarterly
Additionally, to help manage risk for Aave as well, Ethena should commit to a strategy for the gradual and careful unwinding of its Aave exposure, particularly as large PT pools approach maturity. A phased approach helps avoid sudden liquidity shocks on Aave, gives borrow rates time to adjust naturally, and ensures Ethena maintains enough liquid assets to cover redemptions, ultimately lowering systemic risk across both protocols. Llama Risk’s analysis on Aave’s governance forum goes deeper into this point, as well as the broader question of managing Ethena’s Aave exposure.