This post analyses the potential of Coinbase INTX as a new hedging venue for Ethena. Credio (by Untangled) focuses on open interest and funding rates, based on publicly available information.
Open Interest and Market Depth
Open Interest
This table snapshots Coinbase INTX’s Open Interest (OI) vs. those of Binance, the largest perp exchange and the largest venue for Ethena vs. the global OI.
Coinbase INTX currently holds only around 4% of Binance’s OI and around 1.5% of worldwide OI in BTC and ETH.
Total Open Interest
| Global | Binance | Coinbase | |
|---|---|---|---|
| BTC | $32.8B | $11.35B | $470.05M |
| ETH | $15.5B | $5.95B | $244.63M |
| SOL | $1.36B | $84.40M | |
| Source: coinglass at 2025/06/25 |
This line chart compares total aggregated open interest for BTC, ETH, and SOL across all exchanges over the first half of 2025.

Source: Exchanges’ public APIs
BTC maintained a dominant lead in open interest throughout the period, peaking above $45B. ETH consistently held the second position, ranging from $10B–$20B, while SOL lagged with OI typically under $5B. The proportional gap between BTC and others remained steady, reaffirming BTC’s role as the primary instrument in derivatives markets.
This chart shows the cumulative BTC’s OI across major futures exchanges from January 1 to July 1, 2025. Each colored area represents a different exchange, stacked to highlight the contribution of each. The orange line overlays the BTC spot price on the secondary y-axis.
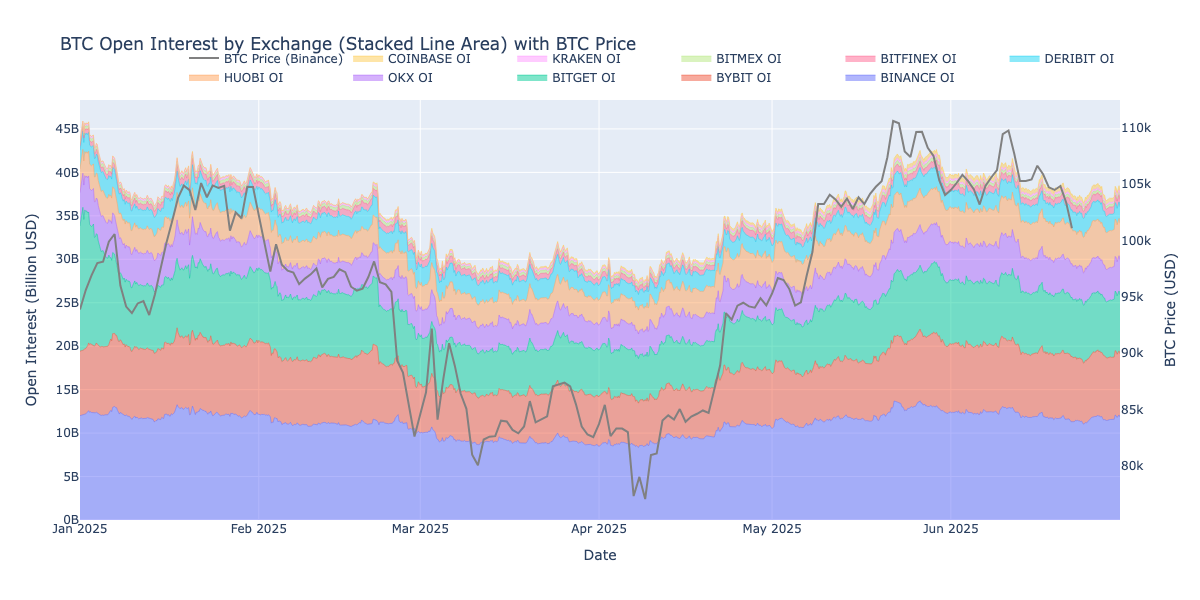
Source: Exchanges’ public APIs
From early January to July 2025, total BTC open interest fluctuated between $25B–$45B. Binance, Bybit, and Bitget consistently held dominant shares. Notably, spikes in OI often preceded or coincided with significant BTC price movements, suggesting leveraged positioning ahead of volatility.
ETH futures OI by exchange is visualized as a stacked area chart, with BTC spot price as an overlaid reference. The time frame spans H1 2025. Unlike BTC market where Coinbase ranks the lowest among the top 10 centralised perp exchanges, it ranks ahead of Kraken, Bitfinex and Bitmex in the ETH market
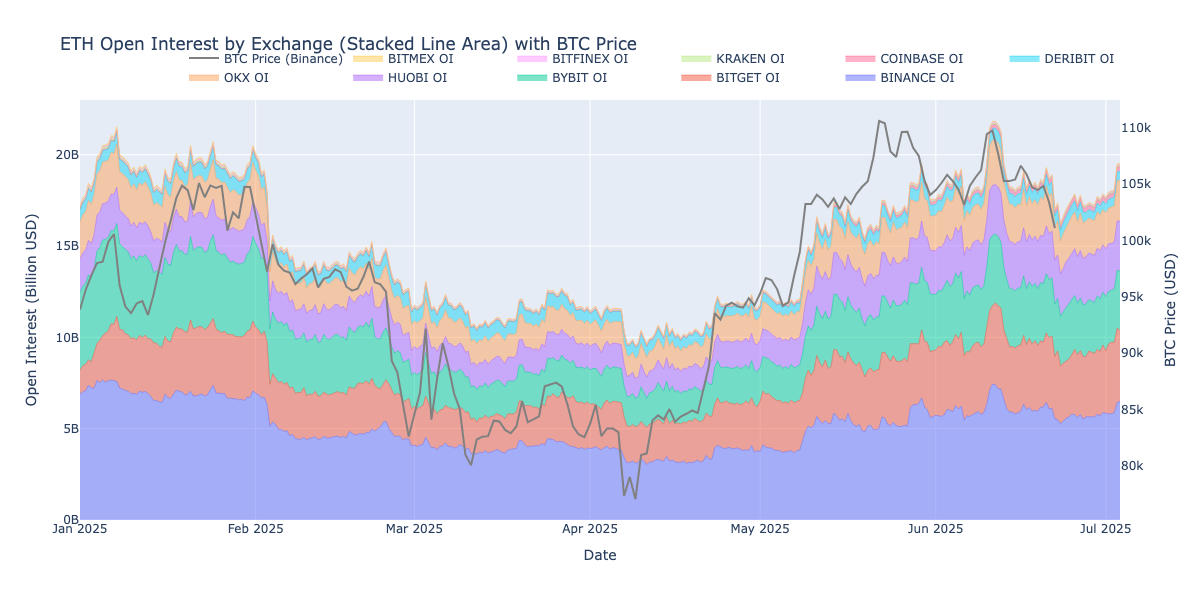
Source: Exchanges’ public APIs
While ETH OI remained smaller than BTC, the patterns loosely mirrored BTC price trends. Notably, increases in ETH OI sometimes anticipated BTC price rallies, hinting at correlated speculative activity.
Solana (SOL) open interest by exchange, stacked by market share, with BTC price overlaid. Time range: Jan–Jul 2025.
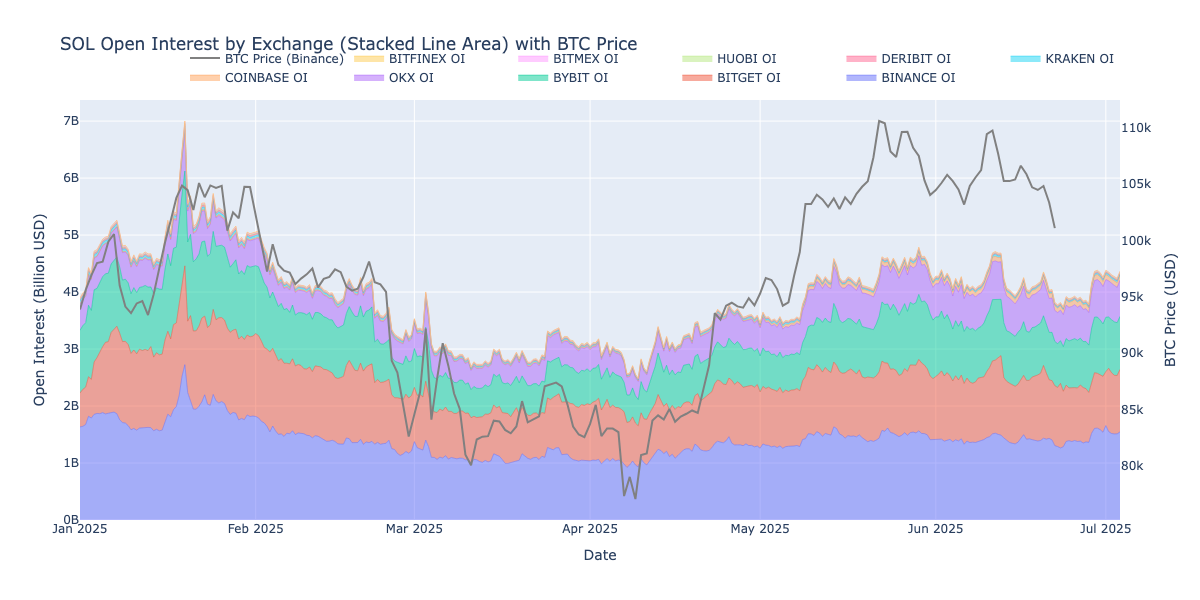
Source: Exchanges’ public APIs
SOL open interest remained significantly lower in magnitude than BTC and ETH, mostly below $5B. Exchanges like Binance, Bitget and Bybit led SOL derivatives volume. Despite its lower notional value, SOL OI showed notable upticks in late Q2, broadly consistent with the overall market development.
Market depth
In terms of trading volume, Coinbase INTX has been seeing $4–5 billion in 24h volume recently, with the BTC-USDC perp alone trading about $3.0B in a day. However, liquidity is concentrated in the largest pairs (BTC, ETH; possibly SOL to a lesser extent). Order books are supported by independent liquidity providers vetted by Coinbase, which likely contributes to relatively tight spreads and reasonable depth in top markets BTC and ETH.
Currently Ethena represents around 3% of global BTC OI and around 9% of global ETH OI across its venues. It would be neither possible nor advisable to put a large size on Coinbase INTX initially, given BTC OI and ETH OI of around $464M and $248M respectively.
Coinbase INTX’s market depth for moderate allocations appears sufficient. The top contracts have high daily turnover (BTC’s OI ~$464M vs $3B+ daily volume, indicating more than 6x turnover per day, so Ethena can enter and exit positions incrementally without major price impact, especially using algorithmic execution. Additionally, Coinbase’s ultra-low latency matching engine and incentives for market makers suggest that liquidity will continue to grow, tightening spreads further. We also note that Coinbase’s spot market launch (BTC/USDC, ETH/USDC) may attract more arbitrageurs and liquidity to INTX’s perp markets, improving depth and convergence with global prices.
Ethena should aim to be a single-digit percentage of Coinbase’s OI per asset at most. For example, an initial $20–25M ETH short on INTX would be ~8–10% of INTX’s ETH OI, and a $30–46M BTC short would be ~6–10% of INTX’s BTC OI, which are in line with or slightly above the thresholds Ethena has aimed for on other venues. These levels should not materially destabilize Coinbase’s market (especially if split among multiple liquidity providers and entered gradually). By keeping Ethena’s share of Coinbase’s OI in this range, Ethena can minimize the risk of dominating the order book or skewing the funding rates.
In summary, Coinbase INTX offers reasonably deep markets for BTC and ETH, suitable for incremental hedging. The liquidity is not as deep as Binance/Bybit, so Ethena should size positions appropriately to avoid liquidity concentration risk. However, the presence of active high-volume trading on INTX (~$4.5B daily) and Coinbase’s efforts to attract market makers signifies that Ethena could execute tens of millions in hedges on INTX without significant slippage. Ethena should employ limit orders or TWAP strategies for entry/exit to minimize market impact.
Funding Rates
Since Ethena’s hedging strategy involves taking short positions in perpetual futures, funding rates (paid by long positions to shorts when the perp price is above the index, or vice versa) directly affect Ethena’s cost or revenue from hedging. Ethena seeks venues where funding is reliably in its favor (i.e. longs pay shorts at a decent rate), or at least not consistently punitive to shorts.
Coinbase INTX uses a standard funding rate model akin to other major exchanges. Funding payments occur on a 1-hour basis (many exchanges use 8-hour cycles). The rate is calculated based on the premium of the perp price over the spot index and an interest rate component. In essence, if perpetuals trade above spot, longs pay shorts, and if below spot, shorts pay longs – with the goal of converging the perp to the spot price (Refer to Calculation).
In the following section, we performed statistical analysis on Coinbase INTX, in comparison with the largest perp exchange, Binance.
Summary statistics for BTC
| Binance | Coinbase | Comments | |
|---|---|---|---|
| Mean APR (%) | 4.690 | 6.346 | Coinbase INTX offers a higher average funding yield: favorable for Ethena’s shorts. |
| Std Dev (%) | 4.664 | 7.703 | Funding on INTX is significantly more volatile: increases PnL variability and requires dynamic risk limits. |
| Skewness | -0.488 | 1.943 | Binance slightly favors balanced or negative funding.Coinbase INTX shows strong right skew: frequent spikes for shorts but also bigger swings. |
| Min (%) | -13.394 | -30.660 | Extreme negative funding possible on INTX: Ethena must monitor tail risks and cap exposure. |
| Max (%) | 10.950 | 108.624 | Coinbase INTX can deliver large positive funding spikes: opportunities for high earnings but also high volatility. |
| 25th Percentile (%) | 1.430 | 2.628 | Even low-end funding on INTX is higher: good for steady carry on shorts. |
| 75th Percentile (%) | 8.590 | 9.636 | Higher upper-quartile funding on INTX: shows consistently elevated positive funding levels for shorts. |
Source: Exchange public API from 2024/12/26 to 2025/06/22 (180 days).
Summary statistics for ETH
| Binance | Coinbase | Comments | |
|---|---|---|---|
| Mean APR (%) | 4.936 | 0.345 | Significantly lower average funding on Coinbase INTX: less attractive for short hedges. |
| Std Dev (%) | 5.210 | 6.384 | Slightly higher volatility on INTX: unpredictability in ETH funding PnL. |
| Skewness | -1.028 | -0.749 | Both negative: funding on ETH tends to lean negative, i.e. shorts may often pay longs. |
| Min (%) | -27.507 | -82.344 | Large negative funding spikes on Coinbase INTX: costly for shorts if market flips bearish. |
| Max (%) | 10.950 | 30.660 | Coinbase INTX has potential positive spikes for shorts, but not reliable due to low mean APR |
| 25th Percentile (%) | 1.368 | -4.380 | 25% of the time, funding is negative on INTX, implying shorts are paying |
| 75th Percentile(%) | 9.530 | 4.380 | Upper quartile funding still lower on INTX than on Binance: even in good conditions, INTX delivers less income for ETH shorts. |
Source: Exchanges’ public APIs
Summary statistics for SOL
| Binance | Coinbase | Comments | |
|---|---|---|---|
| Mean APR (%) | -0.198 | -5.020 | Both negative: shorting SOL incurs average funding costs. INTX is significantly worse, suggesting shorts pay heavily on average. |
| Std Dev (%) | 9.697 | 9.881 | High volatility on both venues: funding is highly unstable for SOL shorts. |
| Skewness | -2.047 | -0.631 | Strong negative skew on Binance indicates frequent deep negative funding spikes. INTX skew is less extreme but still negative: shorts are often at a disadvantage. |
| Min (%) | -77.909 | -86.724 | Both venues show extreme negative funding tails: cost risk for SOL shorts. |
| Max (%) | 10.950 | 63.948 | INTX shows potential large positive funding spikes, but is rare and unpredictable. |
| 25th Percentile (%) | -5.271 | -11.388 | Funding is highly negative on INTX, significantly worse than Binance. |
| 75th Percentile(%) | 7.198 | 1.752 | Even when funding turns positive, INTX underperforms Binance |
Source: Exchanges’ public APIs
Note: Binance uses 8 hours funding fee while Coinbase INTX settles every hour.
In summary, based on data for 180 days ending June 22 2025:
-
BTC: Coinbase INTX offers higher average funding rates, enhancing Ethena’s hedging carry, but comes with greater volatility and tail risk. This requires tight monitoring, dynamic exposure management, and stress testing to safely capture potential funding benefits
-
ETH: The low mean APR, frequent negative funding, and extreme downside spikes suggest ETH hedging on Coinbase INTX should be used only sparingly and opportunistically.
-
SOL: Average funding is deeply negative (–5.02% APR), with extreme negative spikes up to –86.724%. Even during positive periods, upside is limited.
BTC funding rate history chart with BTC price overlay
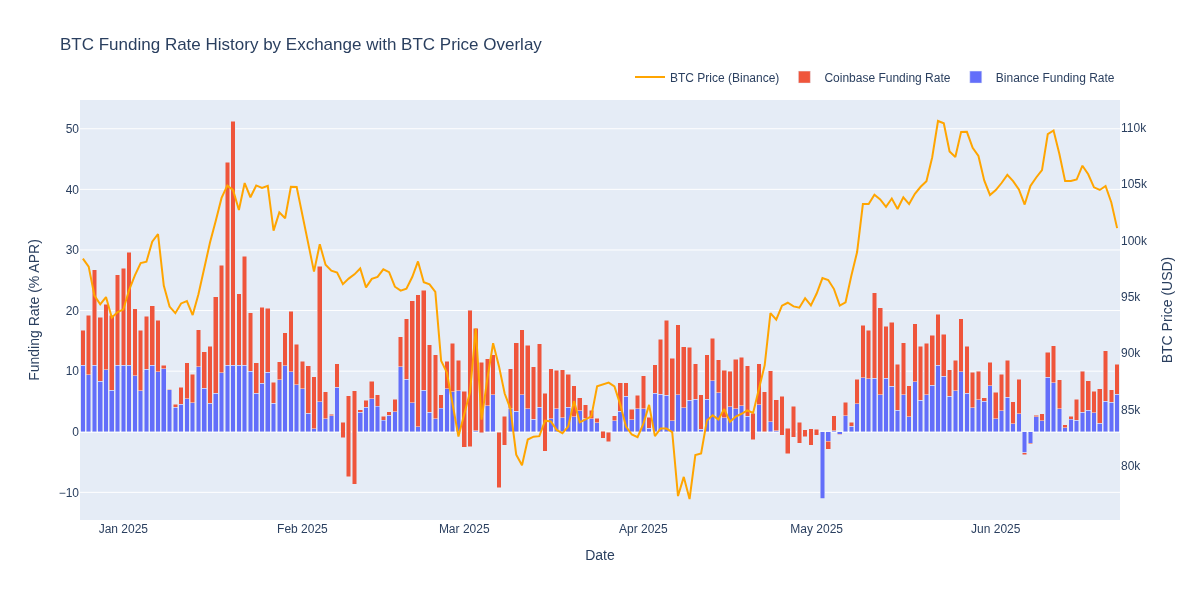
Source: Exchanges’ public APIs
ETH funding rate history chart with BTC price overlay

Source: Exchanges’ public APIs
SOL funding rate history chart with BTC price overlay
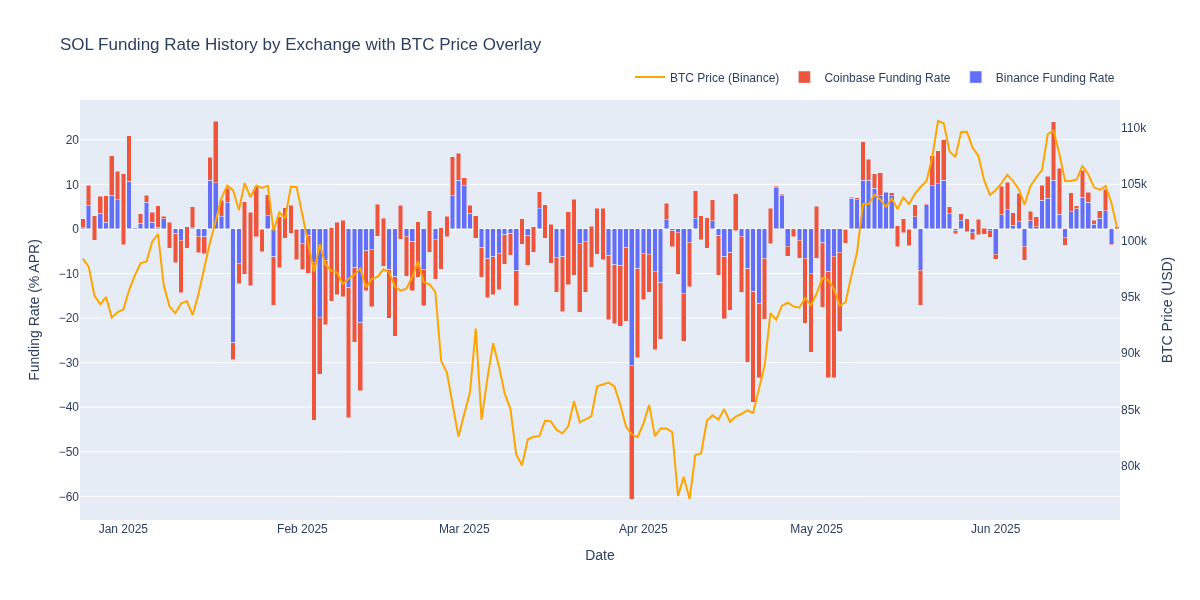
Source: Exchanges’ public APIs
Conclusion
Funding rate heatmap with BTC price overlay
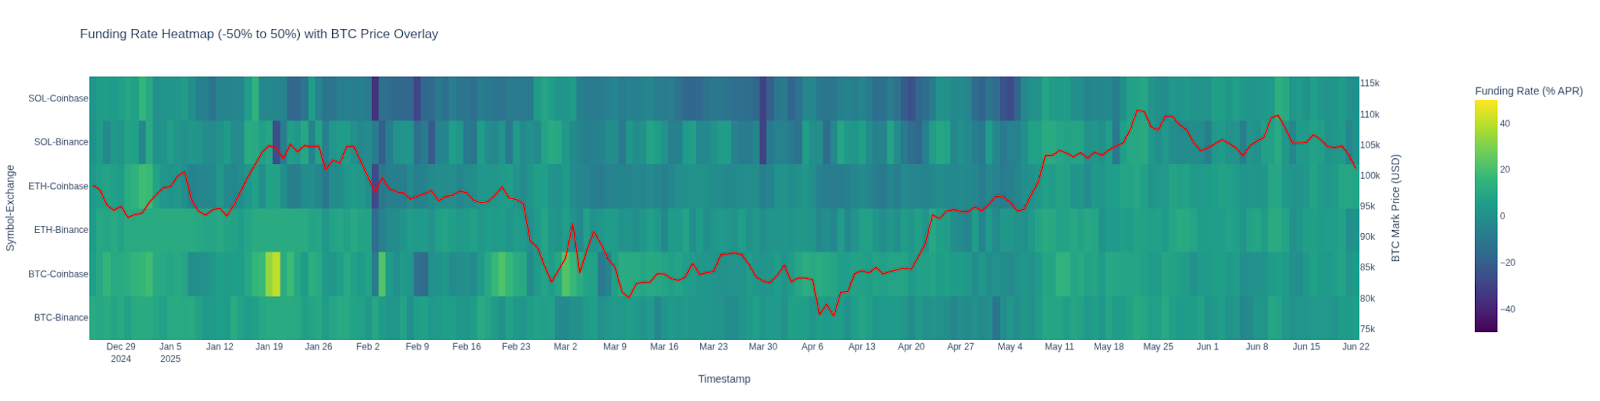
Source: Exchanges’ public APIs
Based on the 180 day data, Coinbase INTX is a viable BTC hedging venue for Ethena, capable of improving yield through higher funding rates. However, the elevated volatility and extreme funding swings mean Ethena should deploy strong risk controls. For ETH and especially SOL, INTX is less suitable due to unfavorable funding conditions and tail risks. Integration should proceed, but with exposure limits capping at 10% and real-time monitoring.