Analysis: Integrating Coinbase INTX as a Hedging Venue
This analysis is aimed at evaluating Coinbase International Exchange (INTX)’s suitability as a hedging venue. We’ve established that to evaluate new exchanges as viable venues for Ethena’s hedging strategies, several key criteria must be met:
- Security: The exchange must have a robust history of security, including regular and up-to-date smart contract audits by top-tier, reputable audit firms.
- Open Interest: The exchange should offer sufficiently large open interest to ensure Ethena’s positions remain a small portion of the total, avoiding any market-moving impact or liquidity concerns.
- Funding Rates: Funding rates must align with those offered on centralized exchanges currently used by Ethena, particularly avoiding lower funding rates.
- Legal and Regulatory Compliance: A thorough legal due diligence process should be conducted and verified by the Ethena Foundation to ensure the exchange operates within acceptable regulatory frameworks.
Security
From a security perspective, Coinbase presents relatively low risk as a trading venue for Ethena. Coinbase International Exchange (INTX) benefits from the broader Coinbase infrastructure, which has a long-standing reputation for reliability, regulatory alignment, and institutional-grade security. Its matching engine is built for deterministic execution and operates on a globally distributed, fault-tolerant Aeron cluster architecture with sub-millisecond latency and high throughput — up to 100,000 messages per second. This ensures not only speed but precision and consistency in trade execution, reducing the likelihood of slippage or order mismatches under stress.
Crucially, assets are not custodied on the exchange itself. Positions are collateralized and settled in USDC, with custody handled through third-party custodians, insulating Ethena from potential solvency or operational risks at the exchange layer. Coinbase also applies strict access control, real-time risk monitoring, and rigorous internal security practices — including regular penetration testing and security audits. Unlike other exchanges, it has no history of major breaches or loss of client funds. These infrastructure, execution, and custody protections together create a highly secure trading environment that aligns well with Ethena’s requirements for counterparty safety, operational resilience, and capital integrity.
Open Interest
We’ve generally established that Ethena’s positions should remain a small share of total open interest of each exchange, ideally no more than 10%, to avoid market impact and liquidity constraints. For that reason, it’s important to estimate the expected open interest on a new exchange, as this sets the upper bound on how much capital can be allocated to it.
Open interest for each asset across exchanges and Ethena's current share
The following charts display the open interest trends over time across the exchanges where Ethena currently holds positions, as well as for Coinbase. Additionally, we highlight Ethena’s current share of the total open interest on each exchange.
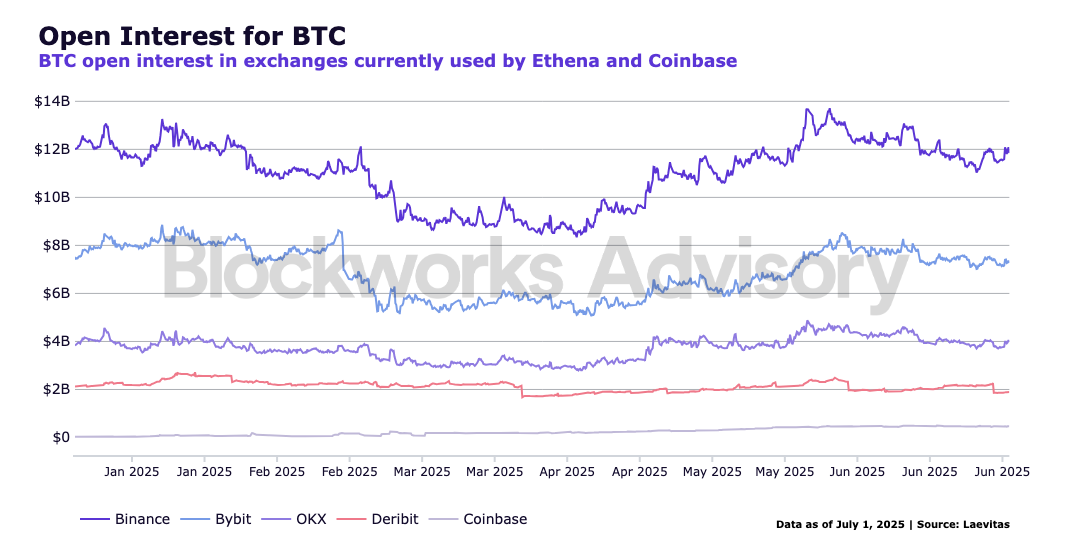
Total BTC open interest as of Jul 7, 2025 (11:00h):
| Exchange | Ethena’s Position | Total Open Interest | Ethena’s Share (%) |
|---|---|---|---|
| Binance | $920.25M | $1.2B | 7.66% |
| Bybit | $436.8M | $7.8B | 5.59% |
| OKX | $329.45M | $4.1B | 8.07% |
| Deribit | $40.35M | $2.0B | 2.00% |
| Coinbase | - | $480M | - |
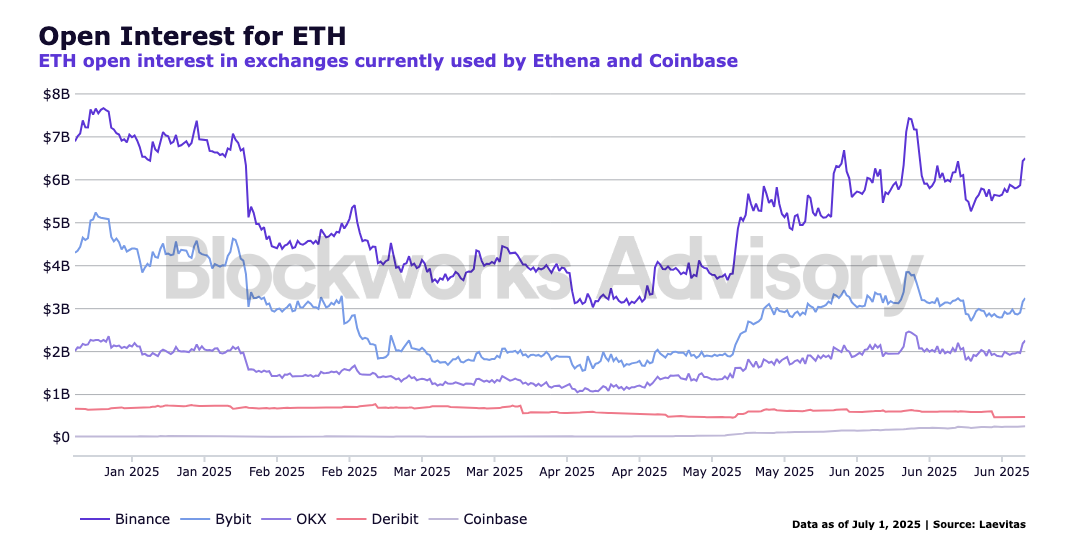
Total ETH open interest as of Jul 7, 2025 (11:00h):
| Exchange | Ethena’s Position | Total Open Interest | Ethena’s Share (%) |
|---|---|---|---|
| Binance | $626.61M | $6.21B | 10.09% |
| Bybit | $257.78M | $2.99B | 8.62% |
| OKX | $109.56M | $2.09B | 5.24% |
| Deribit | $1.56M | $467M | 0.33% |
| Coinbase | - | $255M | - |
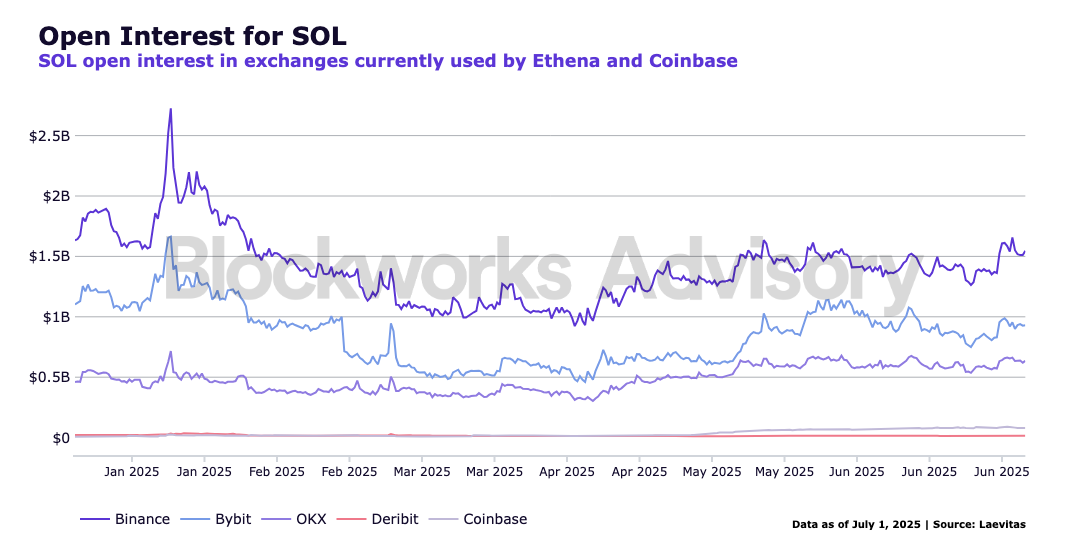
Total SOL open interest as of Jul 7, 2025 (11:00h):
| Exchange | Ethena’s Position | Total Open Interest | Ethena’s Share (%) |
|---|---|---|---|
| Binance | $31.19M | $1.48B | 2.11% |
| Bybit | - | $927M | - |
| OKX | - | $645M | - |
| Deribit | - | $14M | - |
| Coinbase | - | $73M | - |
Based on current open interest levels on Coinbase, this translates into the following maximum capital allocations under our 10% OI threshold: approximately $48 million for BTC, representing around 2.7% of Ethena’s current BTC backing; $26 million for ETH, also about 2.7% of its ETH backing; and $7.3 million for SOL, which amounts to a significantly higher 23.4% of SOL backing.
Although Ethena can currently use Coinbase to hedge only around 3% of its total BTC and ETH positions, open interest on the exchange has been rising sharply, for example, BTC open interest has increased fivefold since the start of the year. This trend suggests that whitelisting Coinbase as a trading venue could become increasingly important in the near future, as growing liquidity expands the capacity for meaningful capital allocation.

Funding rates
Funding rates are typically calculated based on the difference between the contract price and the spot price of the underlying asset, incorporating both an interest component and a premium component.
For Coinbase, the calculation takes the difference between representative futures prices (futures mark) and spot prices (spot mark) every second over an hour. The average of these datapoints will be taken and scaled down to represent the premium between the futures price and spot price over the hour. To create a more stable and smooth funding rate, a smoothing factor is applied.
TWAP (Premium, 1 hour, 1 second) *ɑ) + (Previous Funding Rate) * (1-ɑ)
Where
Premium = (Mark price - Index Price) / Index Price / 24
ɑ = smooth / (n + 1);
smooth = 6;
n = number of previous periods used = 7 (funding interval)

The chart above clearly illustrates significant volatility in funding rates, particularly for SOL, which aligns with our expectations. Annualized funding rates for BTC have not spiked higher than 65% at its peak in December 2024 and have been lower than 20% since March of this year.
When compared to other exchanges where Ethena currently holds positions, Coinbase’s funding rates appear notably more stable, exhibiting lower variability. This is explored in more detail for each asset later in the analysis, but is also consistent with Coinbase’s funding rate methodology, which incorporates smoothing techniques and considers the previous funding period. In contrast, exchanges like Binance calculate funding rates in isolation each cycle, without continuity or smoothing.
In-depth Analysis of BTC: summary statistics, autocorrelation patterns and extreme event analysis
BTC
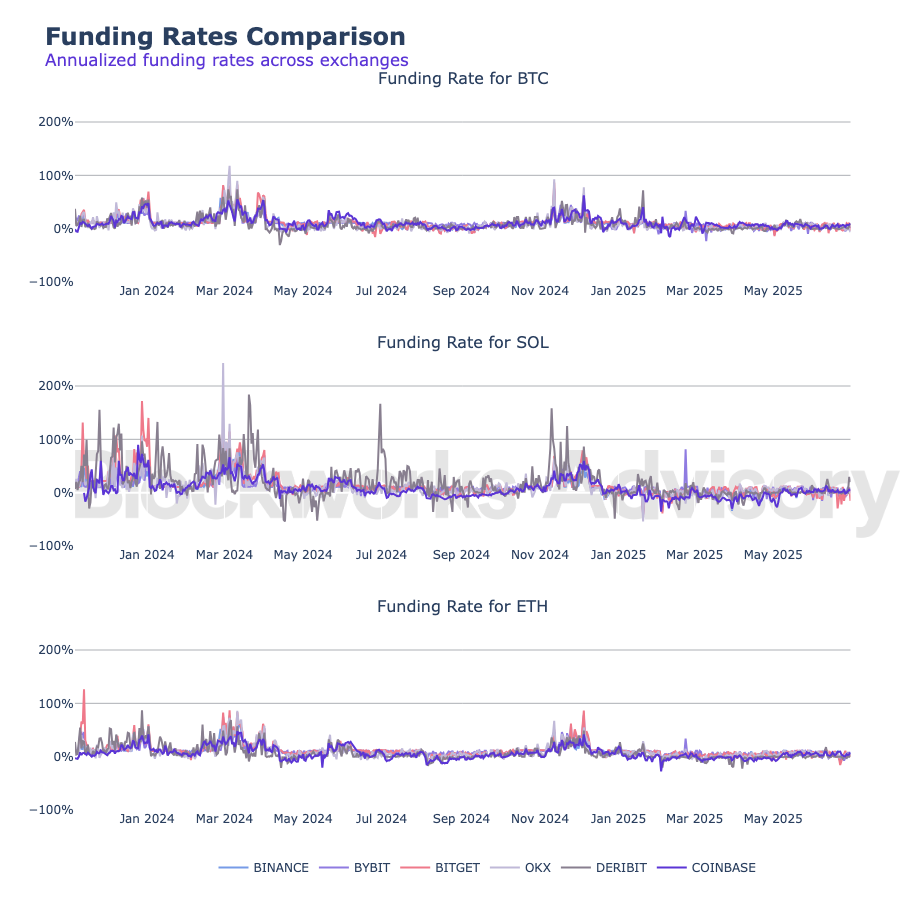
Taking a closer look at the distribution of funding rates across exchanges over the past year allows us to more precisely quantify these differences — examining how they manifest in summary statistics, autocorrelation patterns, and the duration of funding spikes. To capture a wide range of market conditions and better understand how funding rates have behaved across different environments, we analyze historical funding data spanning from November 2023 to June 2025.

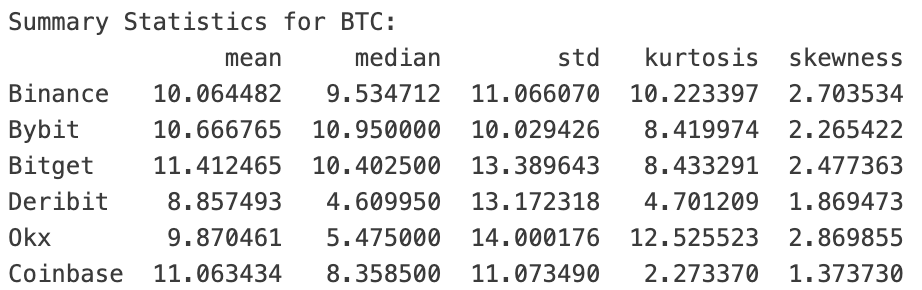
Coinbase’s average annualized funding rate for BTC is 11.06, placing it in second place of the observed exchanges. It’s slightly above Binance (10.06) and Bybit (10.67), but below Bitget (11.41). This suggests that, on average, Coinbase’s BTC funding rates are relatively moderate to high. The median funding rate on Coinbase (8.36) is lower than that of Binance, Bybit, and Bitget. This indicates that while Coinbase’s mean is moderately high, its central tendency is actually lower than most peers. The difference between Coinbase’s mean and median suggests the presence of a few higher funding spikes that pull up the average, which is also supported by the skew and kurtosis values.
Coinbase shows a standard deviation of 11.07, which is in the same ballpark as Binance, and lower than OKX, Deribit and Bitget. This points to low relative variability in Coinbase’s funding rates - less volatile than Deribit, OKX and Bitget, just not as stable as Bybit.
Where Coinbase truly differs is in its distributional shape:
- Kurtosis of 2.27 is the lowest among all exchanges, indicating that Coinbase’s funding distribution is closest to a normal distribution, with fewer extreme outliers or fat tails.
- Skewness of 1.37 is also the lowest, suggesting Coinbase has the least pronounced positive skew. Its funding rates are less right-tailed, meaning fewer unusually high funding spikes compared to other exchanges. This is less beneficial for a basis trade, as profitability depends on high positive funding rates.
This aligns with Coinbase’s smoothed funding rate mechanism, which applies a form of exponential averaging over prior periods. Unlike exchanges like Binance and Bitget, which calculate funding rates on a per-interval basis with no memory, Coinbase’s formula incorporates previous funding rate values. This naturally dampens sudden swings, leading to smoother and less reactive distributions.

The autocorrelation chart displays how the funding rate correlates with its own past values at various time lags (in days). Values near 1 indicate a strong relationship, while values close to 0 suggest little to no correlation.
Among exchanges, Binance exhibits the highest persistence, with autocorrelation values staying high over more days. This implies that funding rates on Binance tend to change more gradually. Coinbase comes as a close second, implying consistent rates, which corroborates the previous findings.
After having established that Coinbases’s funding rates are tendentially slightly lower and display reduced variability, it is also relevant to consider how long spikes in funding rates last, in particular negative ones.
The charts below identify events when an exchange’s funding rate is significantly higher or lower than Binance’s average funding rate. We use Binance’s mean and standard deviation as a benchmark for all exchanges and count an event as significant for any exchange where the funding rate exceeds a threshold around Binance’s mean (more than 2 standard deviations above or below Binance’s mean).
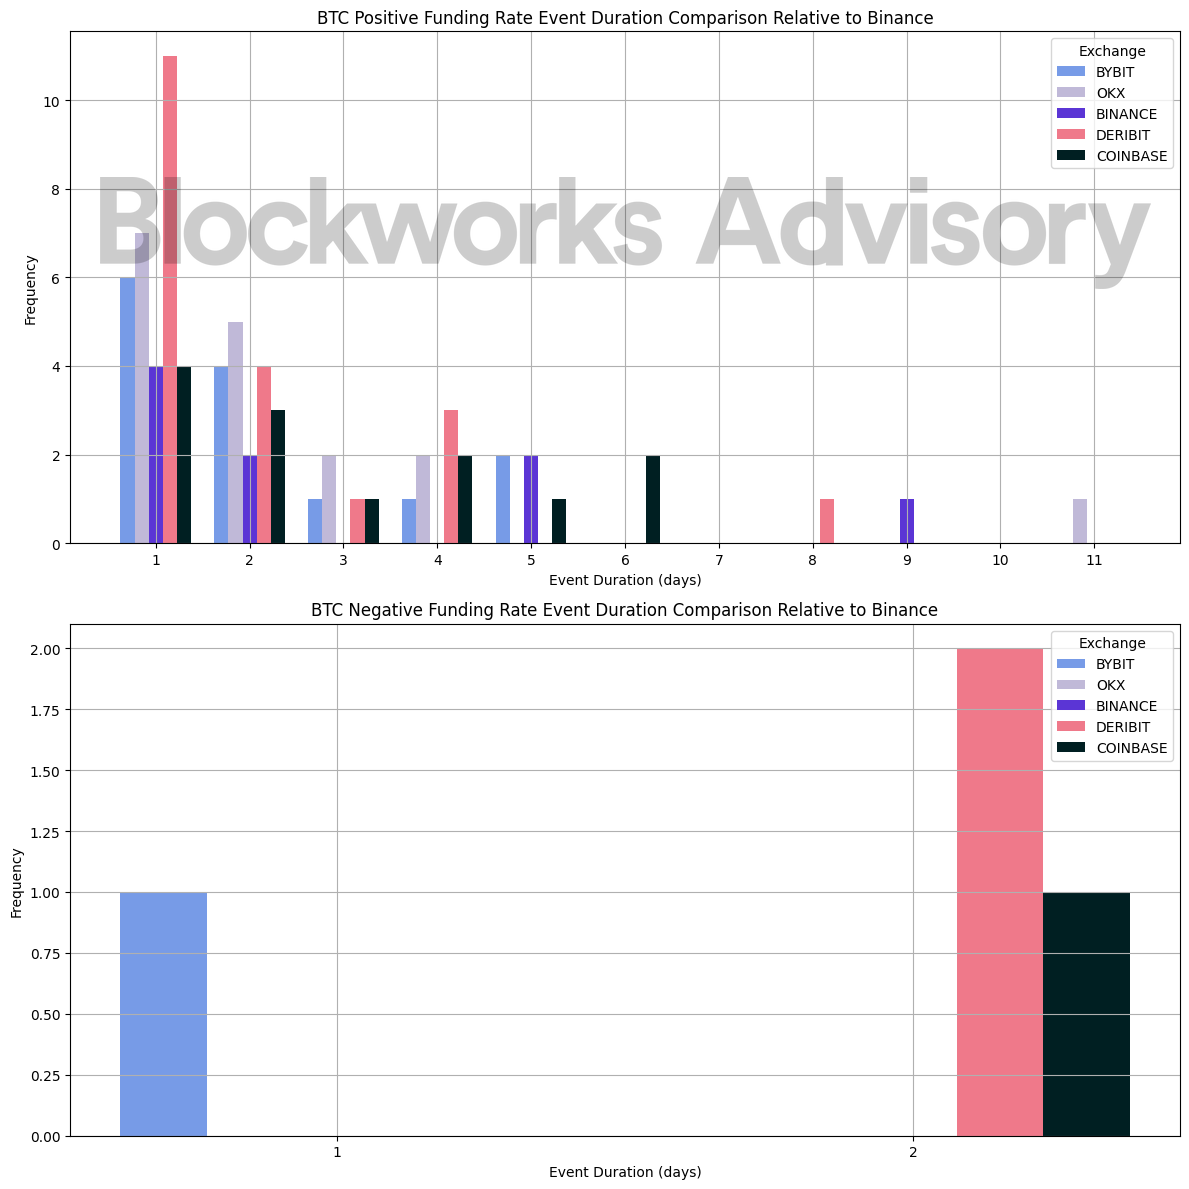
We can observe the event duration and frequency. Long durations indicate persistent deviations from Binance’s threshold (e.g., funding rate remaining high or low relative to Binance). Higher frequency in specific duration ranges shows how often an exchange’s funding rate behaves differently than Binance. For instance, we can see that Coinbase has some events that last one or two days and three events that lasted 5 or 6 days. However, these were all positive funding rate events where Coinbase’s funding rate was much higher than Binance’s average. Only on one occasion was there a negative event, lasting two days.
In-depth Analysis of ETH: summary statistics, autocorrelation patterns and extreme event analysis
ETH

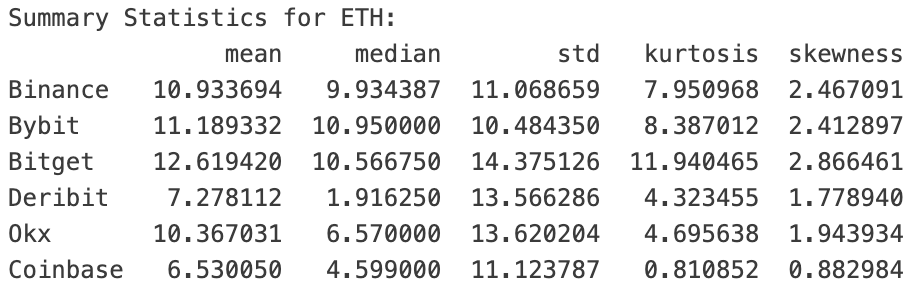
For ETH, the difference between Coinbase and other exchanges is more pronounced than it was for BTC. Coinbase has the lowest mean and second lowest median funding rates for ETH across all exchanges:
- Mean: 6.53 vs. 10–12 on others
- Median: 4.60, far below Bybit (10.95) and Bitget (10.57)
This suggests that ETH perps on Coinbase consistently fund at a lower rate, both on average and across the central distribution. The drop is much sharper than what we saw with BTC, where Coinbase sat in the mid-range.
Volatility (std) is comparable to Binance and Bybit, but lower than Bitget, Deribit, and OKX.
Where Coinbase stands out most is again in its distribution shape:
- Kurtosis: 0.81, significantly below all other venues (next lowest is 4.3)
- Skewness: 0.88, while others are all above 1.7
This means Coinbase’s ETH funding distribution is less heavy-tailed and more symmetrical than others, suggesting a remarkably stable and tightly centered funding environment, even more so than a normal distribution, with very few outliers and almost no fat tails or long positive drifts. BTC also showed lower kurtosis and skewness on Coinbase, but ETH is even more muted.
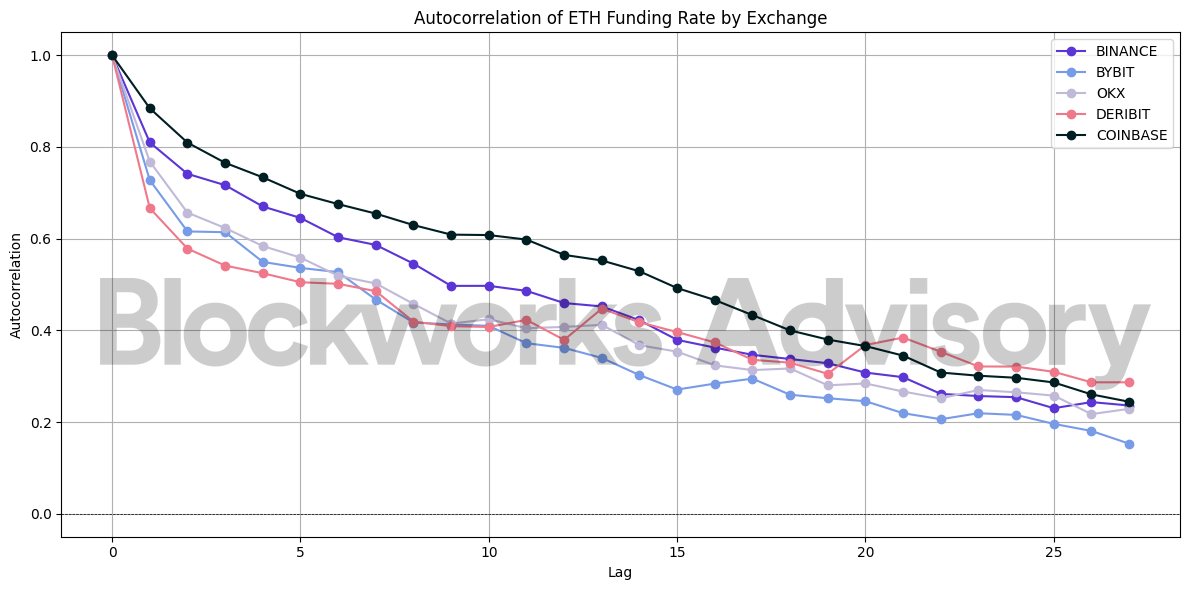
The autocorrelation chart further underscores the stability of ETH funding rates on Coinbase, with each lag showing stronger correlation to the previous one than on any other exchange — including Binance. This suggests smoother, more persistent funding dynamics over time.
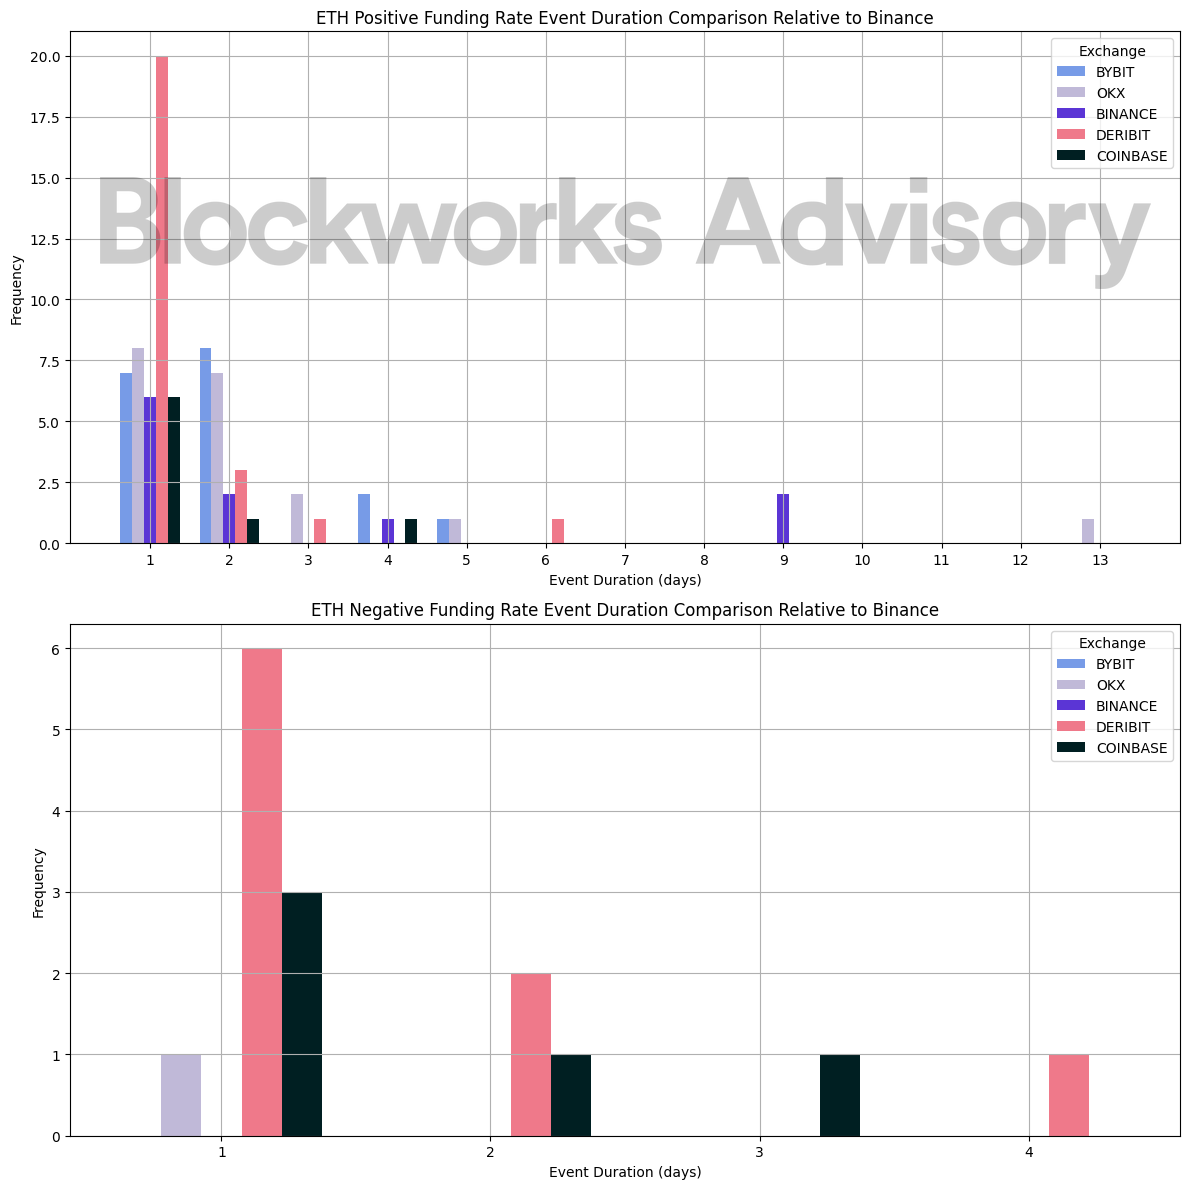
Alongside Deribit, Coinbase recorded the highest number of negative funding rate events during the analyzed period. There were five such occurrences in total — three of them lasting just one day, while the remaining two persisted for two and three days, respectively.
In-depth Analysis of SOL: summary statistics, autocorrelation patterns and extreme event analysis
SOL
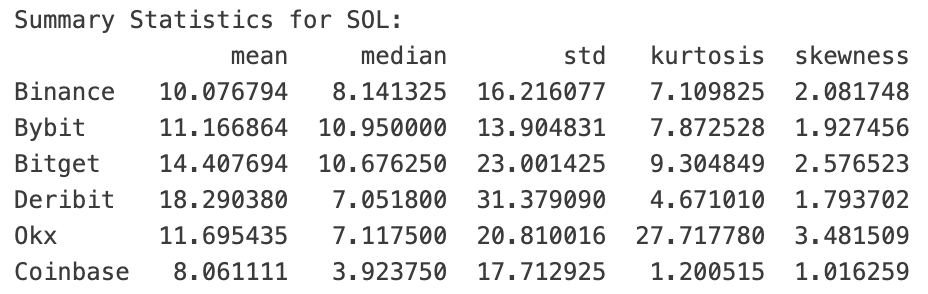
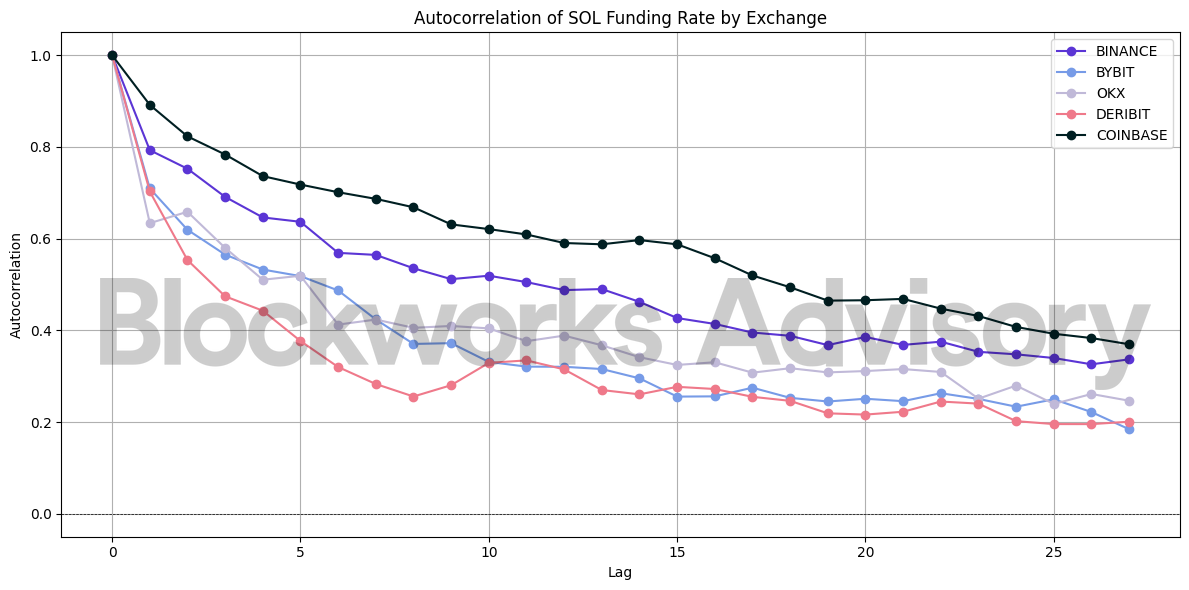
The results for SOL align with previous findings and do not provide relevant additional insights, so we include them for completeness but omit detailed analysis.


Conclusion
While Coinbase exhibits lower median funding rates across all assets—particularly for ETH—making it a less attractive venue from a pure basis trade profitability standpoint, it still plays an important strategic role in Ethena’s broader hedging framework. The stability and predictability of its funding rates, driven by its smoothing mechanism, significantly reduce the risk of unexpected negative carry. For ETH in particular, Coinbase shows the lowest skewness and kurtosis among peers, highlighting an unusually stable and symmetric funding environment.
Whitelisting Coinbase therefore adds value by diversifying counterparty risk and providing the trading team with greater flexibility to optimize funding yields dynamically. In volatile markets, this flexibility can be used to rotate capital toward higher-yielding venues while avoiding negative carry scenarios on Coinbase altogether. As liquidity continues to grow on the platform—evidenced by the sharp rise in open interest—its relevance as a hedging venue is likely to increase, making it prudent to establish infrastructure and whitelisting today in anticipation of expanded usage in the near future.